Disclaimer


This is my unsolicited Point of View and is _not_ a recommendation to buy/sell the security.

*** DO NOT *** attempt to trade unless you FULLY understand the associated (financial/emotional) risks and you FULLY accept responsibility of the results of your actions.

Mind the levels. Manage the risks. Protect your capital. Protect your gains.

Keywords

StudyList (20) $PXP (12) BULLishStocks (10) $BRN (8) $TEL (8) $X (8) $BLOOM (7) $CHP (7) $CPG (7) $MRC (7) $URC (7) $APX (6) $CEI (6) $FLI (6) $JFC (5) $SGI (5) $WPI (5) $BHI (4) $CLC (4) $GERI (4) $MPI (4) $RLC (4) BobbyAxelRod (4) $ACR (3) $AGI (3) $BEL (3) $CROWN (3) $CYBR (3) $DD (3) $DNL (3) $FGEN (3) $MAXS (3) $MBT (3) $MEG (3) $MWC (3) $NOW (3) $PCOR (3) $PGOLD (3) $PLC (3) $RFM (3) $SCC (3) $SMPH (3) $TUGS (3) $VITA (3) PSEIndex (3) TopWeeklyGainersLosers (3) $ATN (2) $BDO (2) $BPI (2) $COSCO (2) $DMC (2) $EEI (2) $EMP (2) $IMI (2) $ION (2) $JGS (2) $LR (2) $LRW (2) $MED (2) $MRP (2) $MWIDE (2) $PHEN (2) $PIP (2) $ROCK (2) $RRHI (2) $SHLPH (2) $SSI (2) $STI (2) $T (2) $WEB (2) $WLCON (2) Above200dayMA (2) TopMonthlyGainersLosers (2) $2GO (1) $ABS (1) $AEV (1) $ALI (1) $ANI (1) $AT (1) $BSC (1) $CNPF (1) $COAL (1) $EW (1) $FNI (1) $FOOD (1) $FPH (1) $GSMI (1) $GTCAP (1) $HOUSE (1) $IDC (1) $LMG (1) $LTG (1) $MER (1) $MRSGI (1) $NIKL (1) $ORE (1) $PHES (1) $PIZZA (1) $POPI (1) $PPC (1) $PX (1) $ROX (1) $RWM (1) $SMC (1) $SSP (1) $VUL (1) NetForeign (1) TechnicalAnalysis (1) Volx5DAvg (1)

Friday, September 29, 2017

$TEL Study 20170929

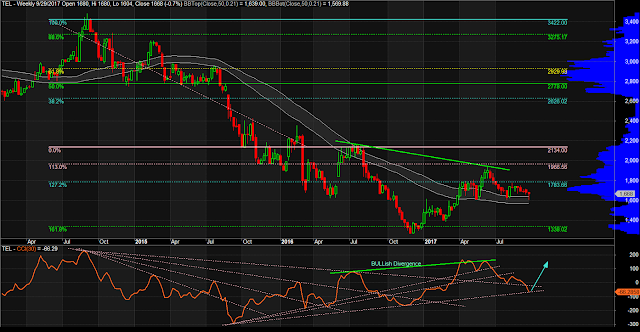
$TEL Weekly Chart as of September 29, 2017
Notes:
1. Will CCI bounce at that trend line support?
2. Price seems to be accumulating round that BB.
$MRC Study 20170929

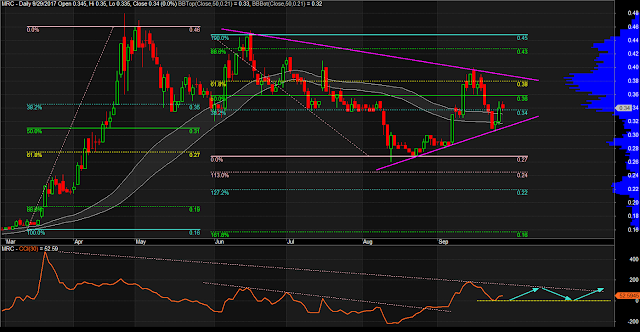
$MRC Daily Chart as of September 29, 2017
Notes:
1. CCI bounced at zero level, will it stay there? Will it break out?
2. Price appears to be moving within that triangle, will it break out?
3. The week closed at 38.2% Fib Ret level, might be best to buy in tranches as you manage the risks and watch the support lines.

#StudyList 20170929

Share ko lang mga nagpapansin sa akin as of September 29th, 2017.

DISCLAIMER: ***strictly for STUDY purposes only*** DO NOT attempt to trade unless you fully understood the associated risks.

Click the link to display the details.

  1. $BHI
  2. $ACR
  3. $MRSGI
  4. $WEB
  5. $MAXS
  6. $PCOR
  7. $CLC
  8. $FLI
  9. $MEG


How do I create my charts? Explained here: https://drive.google.com/file/d/0B5SbOJpLxCy9YXM3cHVUY0ZYa0E/view

$MEG Study 20170929

$MEG Daily Chart as of September 29, 2017
Notes:
1. CCI manages to bounce at that support zone.
2. MACD is above zero line confirming the uptrend.
3. Price is perceived to move along those channels. If this is true, it is still a good time to make a position.

$FLI Study 20170929

$FLI Daily Chart as of September 29, 2017
Notes:
1. Price bounced at 50% Fibonacci Retracement level. Will price move along that channel?
2. CCI made a bounce. Will it continue to move up?
3. MACD is above zero line and this is indicative that trend is uptrend.

$CLC Study 20170929

$CLC Hourly Chart as of September 29, 2017
Notes
1. Mind the chart's time frame.
2. CCI just broke the zero line and must stay above it to convince us of an uptrend.
3. MACD must break out and stay above zero line.

$PCOR Study 20170929

$PCOR Daily Chart as of September 29, 2017
Notes:
1. Mind the Fibonacci Retracement levels.
2. CCI is respecting that trend line support.
3. MACD is telling a buy sentiment.
4. Price must break out of that trend line resistance.

$MAXS Study 20170929

$MAXS Daily Chart as of September 29, 2017

Notes:
1.Previous CCI bounce at zero line resulted to price appreciation. Will the last bounce be any different?
2. MACD is about to cross its signal line. Such is interpreted as a potential buy.
3. BB is relatively flat but came from a decline. This must be an accumulation stage.

$WEB Study 20170929

$WEB Daily Chart as of September 29, 2017
Notes:
1. Price closed above the 50% Fib Ret level. Must stay within this level (might move up after crossing BB).
2. CCI staying above that trend line support. Will it break out of the triangle?
3. MACD about to cross its signal line, suggesting a buy.

$MRSGI Study 20170929

$MRSGI Daily Chart as of September 29, 2017

Notes:
1. CCI bounced, will it continue (and break out of that trend line resistance)? Bounce in the past resulted to price appreciation.
2. Will price continue to move along that channel or will it break out?

$ACR Study 20170929

$ACR Daily Chart as of September 29, 2017
Notes
1. CCI bounced, will it keep moving up? In the past it resulted to price appreciation.
2. Price is perceived to move along that channel. Must break 1.43 first.

$BHI Study 20170929

$BHI Daily Chart as of September 29, 2017

Will CCI make a bounce?

Wednesday, September 27, 2017

$NOW Study 20170927

$NOW Weekly Chart as of September 27, 2017

$BRN Study 20170927

$BRN Weekly Chart as of September 27, 2017

$JFC Study 20170927

$JFC Weekly Chart as of September 27, 2017

$CROWN Study 20170927

$CROWN Weekly Chart as of September 27, 2017v
$CROWN Weekly Chart as of September 27, 2017
The boundaries are very much respected, so far...

$AEV Study 20170927

$AEV Weekly Chart as of September 27, 2017

$CYBR Study 20170927

$CYBR Weekly Chart as of September 27, 2017

$CEI Study 20170927

$CEI Weekly Chart as of September 27, 2017

$T Study 20170927

$T Weekly Chart as of September 27, 2017

#StudyList 20170927

Share ko lang mga nagpapansin sa akin as of September 27th, 2017.

DISCLAIMER: ***strictly for STUDY purposes only*** DO NOT attempt to trade unless you fully understood the associated risks.

Condition: EMA x MA
$CPG
$LTG
$T

Condition: MACD x It's Signal
$CEI
$CYBR
$LTG


Condition: MACD x Zero Line
$AEV


How do I create my charts? Explained here: https://drive.google.com/file/d/0B5SbOJpLxCy9YXM3cHVUY0ZYa0E/view

$LTG Study 20170927

$LTG Weekly Chart as of September 27, 2017

$CPG Study 20170927

$CPG Weekly Chart as of September 27, 2017

$PXP Study 20170927

$PXP Weekly Chart as of September 27, 2017

$X Study 20170927

$X Weekly Chart as of September 27, 2017

$CHP Study 20170927

$CHP Daily Chart as of September 27, 2017

$APX Study 20170927

$APX Weeky Chart as of September 27, 2017

Thursday, September 21, 2017

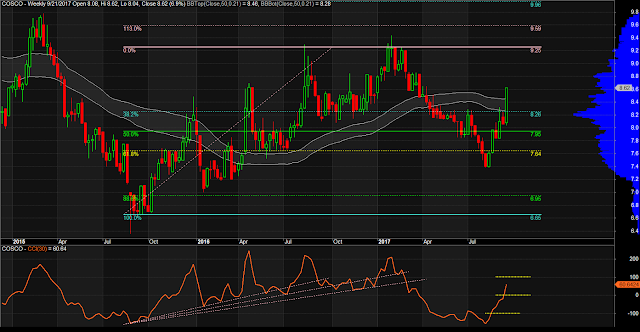
$COSCO Study 20170921

$COSCO Weekly Chart as of September 21, 2017


How do I create my charts? Explained here: https://drive.google.com/file/d/0B5SbOJpLxCy9YXM3cHVUY0ZYa0E/view

$DD Study 20170921

$DD Weekly Chart as of September 21, 2017


How do I create my charts? Explained here: https://drive.google.com/file/d/0B5SbOJpLxCy9YXM3cHVUY0ZYa0E/view

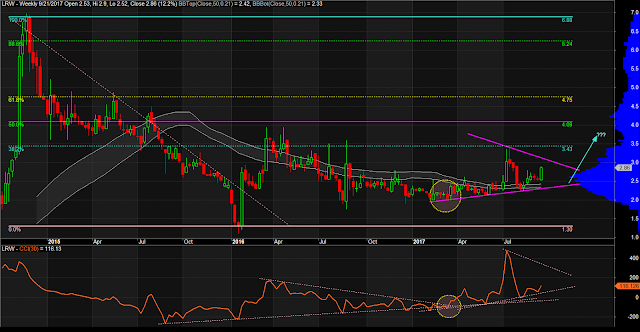
$LRW Study 20170921

$LRW Weekly Chart as of September 21, 2017


How do I create my charts? Explained here: https://drive.google.com/file/d/0B5SbOJpLxCy9YXM3cHVUY0ZYa0E/view

#StudyList 20170921

Share ko lang mga nagpapansin sa akin as of September 21st, 2017.

DISCLAIMER: ***strictly for STUDY purposes only*** DO NOT attempt to trade unless you fully understood the associated risks.

Condition: EMA x MA
$LRW

Condition: MACD x It's Signal
$DD
$GERI

Condition: MACD x Zero Line
N/A

How do I create my charts? Explained here: https://drive.google.com/file/d/0B5SbOJpLxCy9YXM3cHVUY0ZYa0E/view

Wednesday, September 20, 2017

$ORE Study 20170920

$ORE Weekly Chart as of September 20, 2017

$PIZZA Study 20170920

$PIZZA Daily Chart as of September 20, 2017

$SGI Study 20170920

$SGI Weekly Chart as of September 20, 2017
How do I create my charts? Explained here: https://drive.google.com/file/d/0B5SbOJpLxCy9YXM3cHVUY0ZYa0E/view

$SSI Study 20170920

$SSI Weekly Chart as of September 20, 2017

$LR Study 20170920

$LR Weekly Study as of September 20, 2017

$GERI Study 20170920

$GERI Weekly Chart as of September 20, 2017

$CPG Study 20170920

$CPG Weekly Chart as of September 20, 2017

$BRN Study 20170920

$BRN Weekly Chart as of September 20, 2017

#StudyList 20170920

Share ko lang mga nagpapansin sa akin as of September 20th, 2017.

DISCLAIMER: ***strictly for STUDY purposes only*** DO NOT attempt to trade unless you fully understood the associated risks.

Condition: EMA x MA
$BRN
$CPG
$GERI
$LR
$SSI
$VUL

Condition: MACD x It's Signal
$SGI

Condition: MACD x Zero Line
$PIZZA

How do I create my charts? Explained here: https://drive.google.com/file/d/0B5SbOJpLxCy9YXM3cHVUY0ZYa0E/view

Tuesday, September 19, 2017

StudyList 20170919

Share ko lang mga nagpapansin sa akin as of September 19th, 2017.

DISCLAIMER: ***strictly for STUDY purposes only*** DO NOT attempt to trade unless you fully understood the associated risks.

Condition: EMA x MA
$WPI
$MRSGI

Condition: MACD x It's Signal
$WPI
$SSI
$EDC
$MRSGI

Condition: MACD x Zero Line
$ANI

How do I create my charts? Explained here: https://drive.google.com/file/d/0B5SbOJpLxCy9YXM3cHVUY0ZYa0E/view

Monday, September 18, 2017

My Charting Components

You may want to check the descriptions of the following components i use in my charts.
  1. Fibonacci Retracementhttp://stockcharts.com/school/doku.php?st=fibonacci+retracement&id=chart_school:chart_analysis:fibonacci_retracemen
  2. Commodity Channel Indexhttp://stockcharts.com/school/doku.php?id=chart_school:technical_indicators:commodity_channel_index_cci
  3. Bollinger Bandshttp://stockcharts.com/school/doku.php?id=chart_school:technical_indicators:bollinger_bands
  4. MACDhttp://stockcharts.com/school/doku.php?st=macd&id=chart_school:technical_indicators:moving_average_convergence_divergence_macd

$CPG Study 20170918

$CPG Weekly Chart as of September 18, 2017


How do I create my charts? Explained here: https://drive.google.com/file/d/0B5SbOJpLxCy9YXM3cHVUY0ZYa0E/view

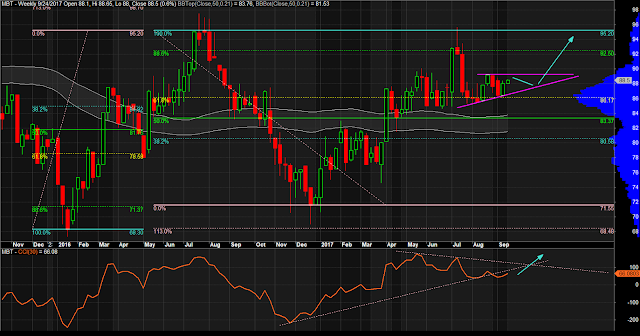
$MBT Study 20170918

$MBT Weekly Chart as of September 18, 2017


How do I create my charts? Explained here: https://drive.google.com/file/d/0B5SbOJpLxCy9YXM3cHVUY0ZYa0E/view


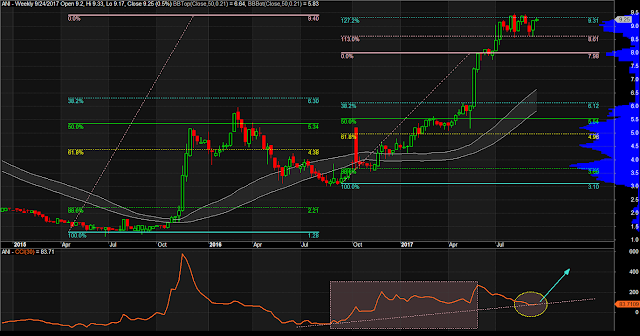
$ANI Study 20170918

$ANI Weekly Chart as of September 18, 2017

How do I create my charts? Explained here: https://drive.google.com/file/d/0B5SbOJpLxCy9YXM3cHVUY0ZYa0E/view

$ANI Daily Chart as of September 18, 2017 at investagrams: https://storage.investagrams.com/files/Chart/tv/2017/09/19/20170919-010345-Ld0vqoIs.jpg

StudyList 20170918

Share ko lang mga nagpapansin sa akin as of September 18th, 2017.

DISCLAIMER: ***strictly for STUDY purposes only*** DO NOT attempt to trade unless you fully understood the associated risks.

Condition: EMA x MA
$ANI
$MBT

Condition: MACD x It's Signal
$LR
$CPG
$ANI
$BDO

Condition: MACD x Zero Line
$SSI
$MBT
$ION

How do I create my charts? Explained here: https://drive.google.com/file/d/0B5SbOJpLxCy9YXM3cHVUY0ZYa0E/view

$SGI Study 20170918

$SGI Weekly Chart as of September 18, 2017

How do I create my charts? Explained here: https://drive.google.com/file/d/0B5SbOJpLxCy9YXM3cHVUY0ZYa0E/view

Saturday, September 16, 2017

$LR Study 20170915

$LR Weekly Chart as of September 15, 2017

$MWC Study 20170915

$MWC Weekly Chart as of September 15, 2017

$EW Study 20170915

$EW Weekly Chart as of September 15, 2017

$JFC Study 20170915

$JFC Weekly Chart as of September 15, 2017

$SMPH Study 20170915

$SMPH Weekly Chart as of September 15, 2017

$JGS Study 20170915

$JGS Weekly Chart as of September 15, 2017

$ATN Study 20170915

$ATN Weekly Chart as of September 15, 2017

$VUL Study 20170915

$VUL Weekly Chart as of September 15, 2017

How I Draw my Charts

You might be wondering how my charts are drawn. Here's how: https://drive.google.com/file/d/0B5SbOJpLxCy9YXM3cHVUY0ZYa0E/view


$SSI Study 20170915

$SSI Weekly Chart as of September 15, 2017

Friday, September 15, 2017