Disclaimer


This is my unsolicited Point of View and is _not_ a recommendation to buy/sell the security.

*** DO NOT *** attempt to trade unless you FULLY understand the associated (financial/emotional) risks and you FULLY accept responsibility of the results of your actions.

Mind the levels. Manage the risks. Protect your capital. Protect your gains.

Keywords

StudyList (20) $PXP (12) BULLishStocks (10) $BRN (8) $TEL (8) $X (8) $BLOOM (7) $CHP (7) $CPG (7) $MRC (7) $URC (7) $APX (6) $CEI (6) $FLI (6) $JFC (5) $SGI (5) $WPI (5) $BHI (4) $CLC (4) $GERI (4) $MPI (4) $RLC (4) BobbyAxelRod (4) $ACR (3) $AGI (3) $BEL (3) $CROWN (3) $CYBR (3) $DD (3) $DNL (3) $FGEN (3) $MAXS (3) $MBT (3) $MEG (3) $MWC (3) $NOW (3) $PCOR (3) $PGOLD (3) $PLC (3) $RFM (3) $SCC (3) $SMPH (3) $TUGS (3) $VITA (3) PSEIndex (3) TopWeeklyGainersLosers (3) $ATN (2) $BDO (2) $BPI (2) $COSCO (2) $DMC (2) $EEI (2) $EMP (2) $IMI (2) $ION (2) $JGS (2) $LR (2) $LRW (2) $MED (2) $MRP (2) $MWIDE (2) $PHEN (2) $PIP (2) $ROCK (2) $RRHI (2) $SHLPH (2) $SSI (2) $STI (2) $T (2) $WEB (2) $WLCON (2) Above200dayMA (2) TopMonthlyGainersLosers (2) $2GO (1) $ABS (1) $AEV (1) $ALI (1) $ANI (1) $AT (1) $BSC (1) $CNPF (1) $COAL (1) $EW (1) $FNI (1) $FOOD (1) $FPH (1) $GSMI (1) $GTCAP (1) $HOUSE (1) $IDC (1) $LMG (1) $LTG (1) $MER (1) $MRSGI (1) $NIKL (1) $ORE (1) $PHES (1) $PIZZA (1) $POPI (1) $PPC (1) $PX (1) $ROX (1) $RWM (1) $SMC (1) $SSP (1) $VUL (1) NetForeign (1) TechnicalAnalysis (1) Volx5DAvg (1)

Friday, January 12, 2018

Study List (January 12, 2018)

Study List (January 12, 2018)

Notes: stocks listed here have increasing volume in the past three trading days.


Watch List (End-of-Day, 12 January 2018)

Watch List (End-of-Day, 12 January 2018)
Notes: the general idea here is that a stock whose Stochastic is below 20 is considered at oversold level (and we only consider a second look at the stock when Stochastic crossed over 20). 

Vol vs 20D Avg is the ratio of today's volume against the 20-day vx`olume average. Vol vs 50D Avg is the ratio of today's volume against the 50-day volume average. A value greater than 1 means today's volume is higher than the average (while a value less than 1 means today's volume is lower than the average). A green highlight means today's volume is 50% or more than the average (while a yellow highlight means today's volume is greater than the average but less than 50% more of the average).

Listing Criteria:
1. Volume today must be more than 1M.
2. Stochastic is below 22.

Mind the levels. Manage the risks. Protect your capital. Protect your gains.
DISCLAIMER: This is my unsolicited Point oView and is _not_ a recommendation to buy/sell the security.

*** DO NOT *** attempt to trade unless you FULLY understand the associated (financial/emotional) risks and you FULLY accept responsibility of the results of your actions.

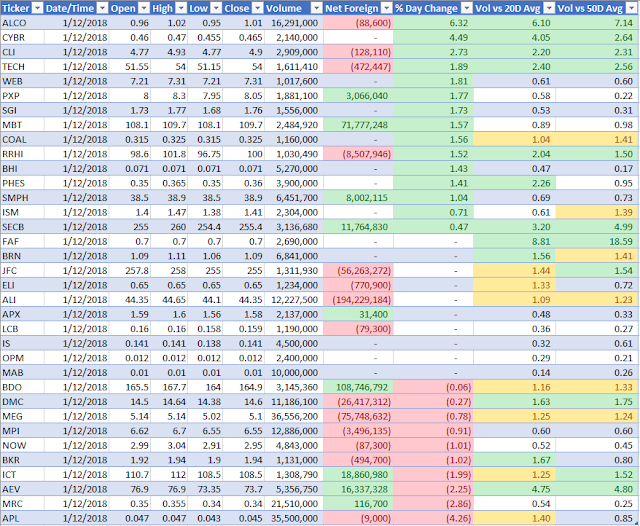
Volume versus 5-day Volume Average 20180112

Volume versus 5-day Volume Average (12 January 2018)


Notes: our list focuses on comparing last trading day volume versus the 5-day volume average and we are interested with those footprint that are more that 50% the 5-day volume average.

Top Weekly Gainers / Losers 20180112

Top Weekly Gainers / Losers (12 January 2018)


Saturday, January 6, 2018

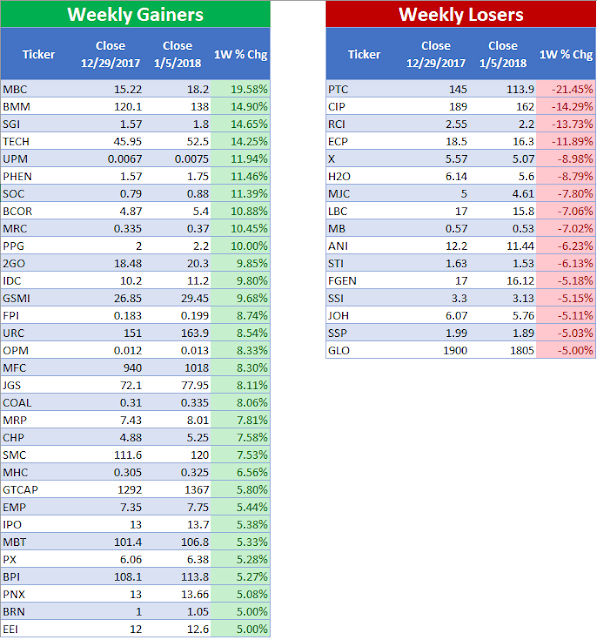
Top Weekly Gainers / Losers 20170105

Top Weekly Gainers / Losers (January 5, 2018)


Mind the levels. Manage the risks. Protect your capital. Protect your gains.

DISCLAIMER: This is my unsolicited Point oView and is _not_ a recommendation to buy/sell the security. 

*** DO NOT *** attempt to trade unless you FULLY understand the associated (financial/emotional) risks and you FULLY accept responsibility of the results of your actions.


Study List 20180105

These stocks have increasing volume in the past three trading days (the first seven have a traded last Jan 5th with a volume more than 50% of their 5-day volume average).

  1. $CNPF
  2. $LTG
  3. $SMC
  4. $URC
  5. $MAC
  6. $SGI
  7. $PHEN
  8. $MPI
  9. $HOUSE
  10. $BRN
  11. $NOW
  12. $DNL
  13. $MBT
  14. $JGS
  15. $AEV
  16. $RLT
  17. $CHP
  18. $SMPH
  19. $VLL
  20. $IDC


Mind the levels. Manage the risks. Protect your capital. Protect your gains.

DISCLAIMER: This is my unsolicited Point of View and is _not_ a recommendation to buy/sell the security. 

*** DO NOT *** attempt to trade unless you FULLY understand the associated (financial/emotional) risks and you FULLY accept responsibility of the results of your actions.


Monday, January 1, 2018

$MPI Study 20171229

$MPI Weekly Chart as of December 29, 2017

Notes: will the break out be any time soon?

Mind the levels. Manage the risks. Protect your capital. Protect your gains.

DISCLAIMER: This is my unsolicited Point oView and is _not_ a recommendation to buy/sell the security.

*** DO NOT *** attempt to trade unless you FULLY understand the associated (financial/emotional) risks and you FULLY accept responsibility of the results of your actions.


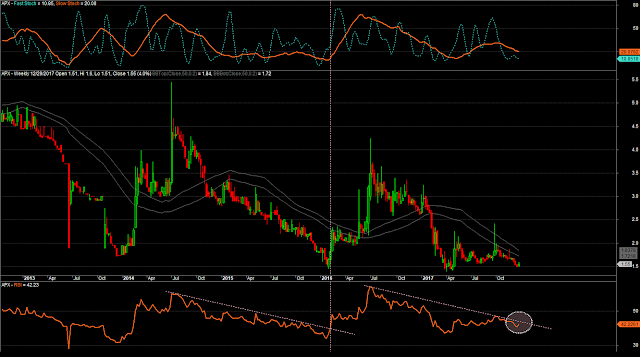
$APX Study 20171229

$APX Weekly Chart as of December 29, 2017


Notes: will the pattern make a repeat?

Mind the levels. Manage the risks. Protect your capital. Protect your gains.

DISCLAIMER: This is my unsolicited Point oView and is _not_ a recommendation to buy/sell the security.

*** DO NOT *** attempt to trade unless you FULLY understand the associated (financial/emotional) risks and you FULLY accept responsibility of the results of your actions.


$EMP Study 20171229

$EMP Weekly Chart as of December 29, 2017


Notes: prices might not stay inside the box forever.

Mind the levels. Manage the risks. Protect your capital. Protect your gains.
DISCLAIMER: This is my unsolicited Point oView and is _not_ a recommendation to buy/sell the security.

*** DO NOT *** attempt to trade unless you FULLY understand the associated (financial/emotional) risks and you FULLY accept responsibility of the results of your actions.

$RWM Study 20171229

$RWM Weekly Chart as of December 29, 2017


Notes: two years in a box might be long enough.

Mind the levels. Manage the risks. Protect your capital. Protect your gains.

DISCLAIMER: This is my unsolicited Point oView and is _not_ a recommendation to buy/sell the security.

*** DO NOT *** attempt to trade unless you FULLY understand the associated (financial/emotional) risks and you FULLY accept responsibility of the results of your actions.


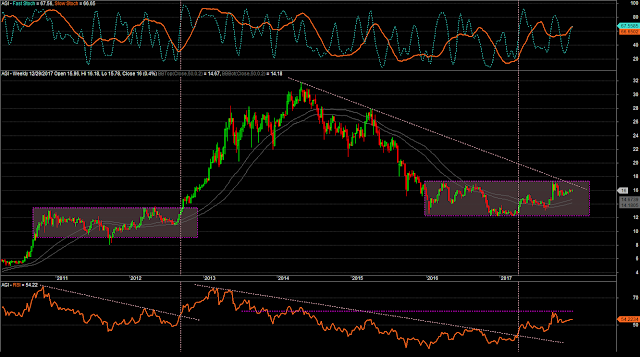
$AGI Study 20171229

$AGI Weekly Chart as of December 29, 2017


Notes: will the pattern make a repeat?

Mind the levels. Manage the risks. Protect your capital. Protect your gains.

DISCLAIMER: This is my unsolicited Point oView and is _not_ a recommendation to buy/sell the security.

*** DO NOT *** attempt to trade unless you FULLY understand the associated (financial/emotional) risks and you FULLY accept responsibility of the results of your actions.

$SGI Study 20171229

$SGI Daily Chart as of December 29, 2017


Note: please see image for details.

Mind the levels. Manage the risks. Protect your capital. Protect your gains.

DISCLAIMER: This is my unsolicited Point oView and is _not_ a recommendation to buy/sell the security. 

*** DO NOT *** attempt to trade unless you FULLY understand the associated (financial/emotional) risks and you FULLY accept responsibility of the results of your actions.

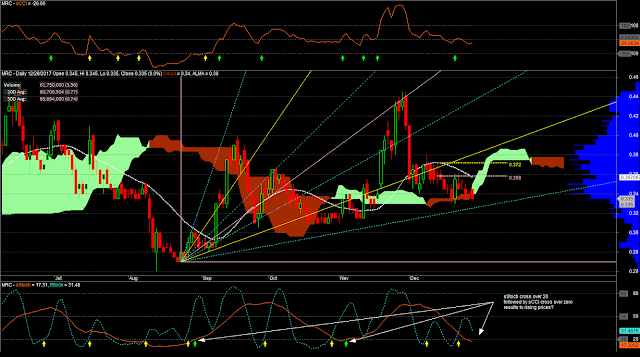
$MRC Study 20171229

$MRC Daily Chart as of December 29, 2017


Mind the levels. Manage the risks. Protect your capital. Protect your gains.

DISCLAIMER: This is my unsolicited Point oView and is _not_ a recommendation to buy/sell the security.

*** DO NOT *** attempt to trade unless you FULLY understand the associated (financial/emotional) risks and you FULLY accept responsibility of the results of your actions.

$PXP Study 20171229

$PXP Daily Chart as of December 29, 2017


Note: this is an update to $PXP Study last Dec 22nd.

Mind the levels. Manage the risks. Protect your capital. Protect your gains.

DISCLAIMER: This is my unsolicited Point oView and is _not_ a recommendation to buy/sell the security.

*** DO NOT *** attempt to trade unless you FULLY understand the associated (financial/emotional) risks and you FULLY accept responsibility of the results of your actions.

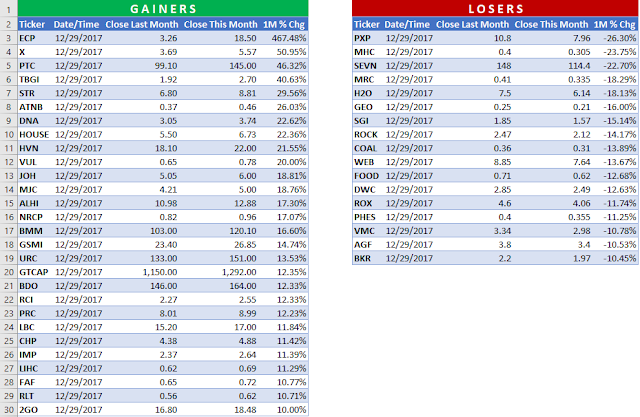
Top Monthly Gainers / Losers 20171229

Top Monthly Gainers / Losers of December 2017


Mind the levels. Manage the risks. Protect your capital. Protect your gains.

DISCLAIMER: This is my unsolicited Point oView and is _not_ a recommendation to buy/sell the security. 

*** DO NOT *** attempt to trade unless you FULLY understand the associated (financial/emotional) risks and you FULLY accept responsibility of the results of your actions.