Disclaimer


This is my unsolicited Point of View and is _not_ a recommendation to buy/sell the security.

*** DO NOT *** attempt to trade unless you FULLY understand the associated (financial/emotional) risks and you FULLY accept responsibility of the results of your actions.

Mind the levels. Manage the risks. Protect your capital. Protect your gains.

Keywords

StudyList (20) $PXP (12) BULLishStocks (10) $BRN (8) $TEL (8) $X (8) $BLOOM (7) $CHP (7) $CPG (7) $MRC (7) $URC (7) $APX (6) $CEI (6) $FLI (6) $JFC (5) $SGI (5) $WPI (5) $BHI (4) $CLC (4) $GERI (4) $MPI (4) $RLC (4) BobbyAxelRod (4) $ACR (3) $AGI (3) $BEL (3) $CROWN (3) $CYBR (3) $DD (3) $DNL (3) $FGEN (3) $MAXS (3) $MBT (3) $MEG (3) $MWC (3) $NOW (3) $PCOR (3) $PGOLD (3) $PLC (3) $RFM (3) $SCC (3) $SMPH (3) $TUGS (3) $VITA (3) PSEIndex (3) TopWeeklyGainersLosers (3) $ATN (2) $BDO (2) $BPI (2) $COSCO (2) $DMC (2) $EEI (2) $EMP (2) $IMI (2) $ION (2) $JGS (2) $LR (2) $LRW (2) $MED (2) $MRP (2) $MWIDE (2) $PHEN (2) $PIP (2) $ROCK (2) $RRHI (2) $SHLPH (2) $SSI (2) $STI (2) $T (2) $WEB (2) $WLCON (2) Above200dayMA (2) TopMonthlyGainersLosers (2) $2GO (1) $ABS (1) $AEV (1) $ALI (1) $ANI (1) $AT (1) $BSC (1) $CNPF (1) $COAL (1) $EW (1) $FNI (1) $FOOD (1) $FPH (1) $GSMI (1) $GTCAP (1) $HOUSE (1) $IDC (1) $LMG (1) $LTG (1) $MER (1) $MRSGI (1) $NIKL (1) $ORE (1) $PHES (1) $PIZZA (1) $POPI (1) $PPC (1) $PX (1) $ROX (1) $RWM (1) $SMC (1) $SSP (1) $VUL (1) NetForeign (1) TechnicalAnalysis (1) Volx5DAvg (1)

Wednesday, November 29, 2017

$MRP Study 20171129

$MRP Weekly Chart as of November 29, 2017

Notes: The chart is "beautiful". Please see image for details.

Mind the levels. Manage the risks. Protect your capital. Protect your gains.

DISCLAIMER: This is my unsolicited Point of View and is _not_ a recommendation to buy/sell the security.

*** DO NOT *** attempt to trade unless you FULLY understand the associated (financial/emotional) risks and you FULLY accept responsibility of the results of your actions.

$JFC Study 20171129

$JFC Daily Chart as of November 29, 2017

Notes: Just an update from Nov 15 study.

Mind the levels. Manage the risks. Protect your capital. Protect your gains.

DISCLAIMER: This is my unsolicited Point of View and is _not_ a recommendation to buy/sell the security.

*** DO NOT *** attempt to trade unless you FULLY understand the associated (financial/emotional) risks and you FULLY accept responsibility of the results of your actions.

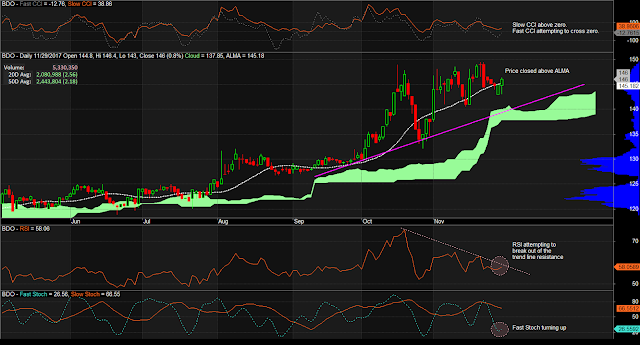
$BDO Study 20171129

$BDO Daily Chart as of November 29, 2017


Notes:
1. Price above that trend line support and closed above ALMA.
2. Slow CCI above zero with Fast CCI moving in that direction too.
3. RSI moving to break that trend line resistance.
4. Fast Stoch turned up.

Mind the levels. Manage the risks. Protect your capital. Protect your gains.

DISCLAIMER: This is my unsolicited Point of View and is _not_ a recommendation to buy/sell the security.

*** DO NOT *** attempt to trade unless you FULLY understand the associated (financial/emotional) risks and you FULLY accept responsibility of the results of your actions.


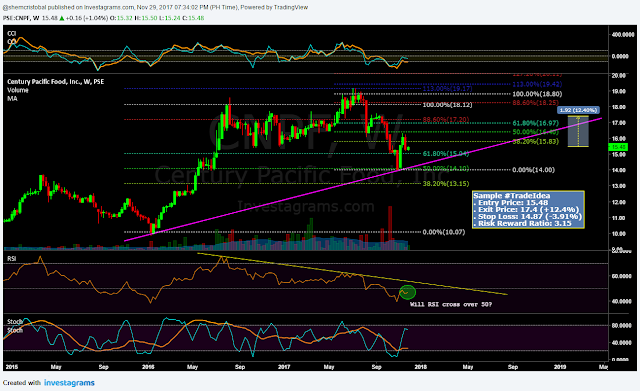
$CNPF Study 20171129

$CNPF Weekly Chart as of November 29, 2017


Notes:
1. RSI is poised to cross over 50. Will it happen?
2. Trading near a trend line support
3. Slow CCI must cross over -100.
4. Slow Stochastic must continue rising.
5. Sample #TradeIdea

  • Entry Price: 15.48
  • Exit Price: 17.4 (+12.4%)
  • Stop Loss: 14.87 (-3.91%)
  • Risk Reward Ratio: 3.15


Mind the levels. Manage the risks. Protect your capital. Protect your gains.

DISCLAIMER: This is my unsolicited Point of View and is _not_ a recommendation to buy/sell the security.

*** DO NOT *** attempt to trade unless you FULLY understand the associated (financial/emotional) risks and you FULLY accept responsibility of the results of your actions.

Tuesday, November 28, 2017

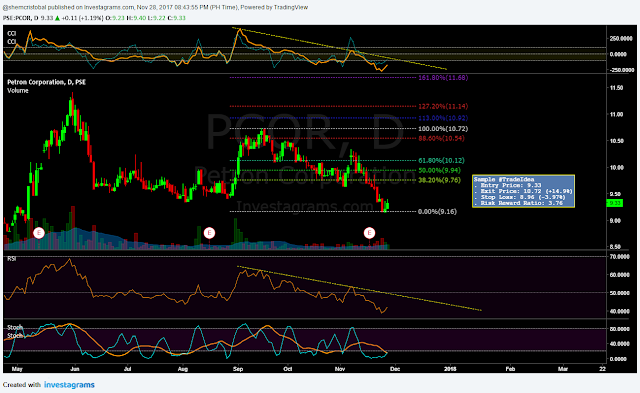
$PCOR Study 20171128

$PCOR Daily Chart as of November 28, 2017


Notes:
1. Consecutive green candles.
2. CCI heading to test the -100 level / trend line resistance.
3. RSI heading to test the trend line resistance.
4. Fast Stochastic rising (possibly breaking 20 level). We want Slow Stoch to turn up and rise above 20 level.
5. Sample #TradeIdea

  • Entry Price: 9.33
  • Exit Price: 10.72 (+14.9%)
  • Stop Loss: 8.97 (-3.91%)
  • Risk Reward Ratio: 3.86

Mind the levels. Manage the risks. Protect your capital. Protect your gains.

DISCLAIMER: This is my unsolicited Point of View and is _not_ a recommendation to buy/sell the security. 
*** DO NOT *** attempt to trade unless you FULLY understand the associated (financial/emotional) risks and you FULLY accept responsibility of the results of your actions.

Monday, November 27, 2017

$BLOOM Study 20171128

$BLOOM Daily Chart as of November 28, 2017


Note: This is an update to the $BLOOM Study last November 17th.

Mind the levels. Manage the risks. Protect your capital. Protect your gains.

DISCLAIMER: This is my unsolicited Point of View and is _not_ a recommendation to buy/sell the security.

*** DO NOT *** attempt to trade unless you FULLY understand the associated (financial/emotional) risks and you FULLY accept responsibility of the results of your actions.

$TUGS Study 20171127

$TUGS Daily Chart as of November 27, 2017


Notes:
1. New 52-Week High reached today.
2. CCIs are well above zero.
3. RSI is attempting to break out of 70 level. (Favorable price actions happen when RSI is above 70.)
4. Both Stochastic are turned up and rising.


Mind the levels. Manage the risks. Protect your capital. Protect your gains.

DISCLAIMER: This is my unsolicited Point of View and is _not_ a recommendation to buy/sell the security.
*** DO NOT *** attempt to trade unless you FULLY understand the associated (financial/emotional) risks and you FULLY accept responsibility of the results of your actions.


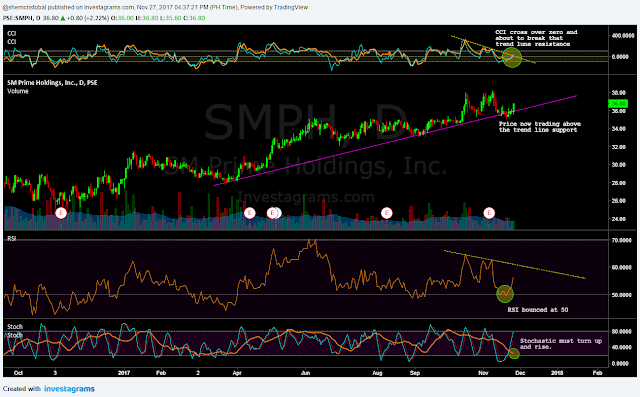
$SMPH Study 20171127

$SMPH Daily Chart as of November 27, 2017


Notes:
1. Price now trading above the trend line support
2. CCI crossed over zero and breaking out of that trend line resistance.
3. RSI rising after a bounce at 50 level.
4. Slow Stochastic must turn up and rise.


Mind the levels. Manage the risks. Protect your capital. Protect your gains.

DISCLAIMER: This is my unsolicited Point of View and is _not_ a recommendation to buy/sell the security.
*** DO NOT *** attempt to trade unless you FULLY understand the associated (financial/emotional) risks and you FULLY accept responsibility of the results of your actions.

Sunday, November 26, 2017

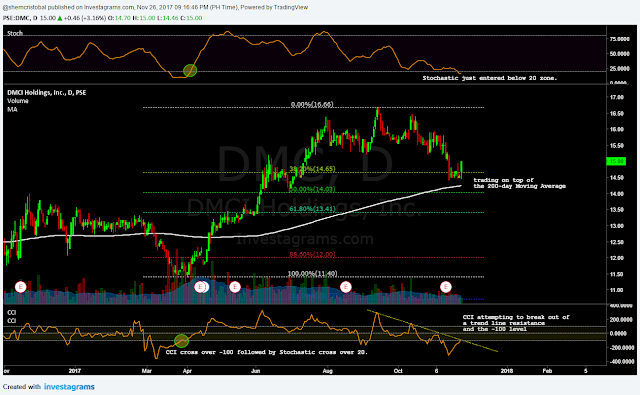
$DMC Study 20171124

$DMC Daily Chart as of November 24, 2017


Please see image for details.


Mind the levels. Manage the risks. Protect your capital. Protect your gains.

DISCLAIMER: This is my unsolicited Point of View and is _not_ a recommendation to buy/sell the security.
*** DO NOT *** attempt to trade unless you FULLY understand the associated (financial/emotional) risks and you FULLY accept responsibility of the results of your actions.


Friday, November 24, 2017

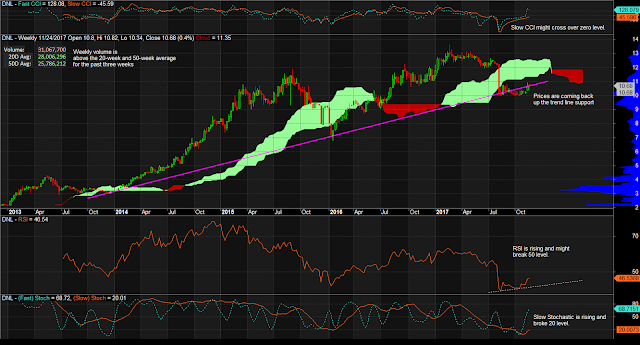
$DNL Study 20171124

$DNL Weekly Chart as of November 24, 2017


Notes: Please see image for details. I consider the following as buy signals:
1. CCI crossing over -100 (very high risk!) or zero levels.
2. RSI crossing over 50 level.
3. Stochastic crossing over 20 level.

Mind the levels. Manage the risks. Protect your capital. Protect your gains.

DISCLAIMER: This is my unsolicited Point of View and is _not_ a recommendation to buy/sell the security. *** DO NOT *** attempt to trade unless you FULLY understand the associated (financial/emotional) risks and you FULLY accept responsibility of the results of your actions.

$PXP Study 20171124

$PXP Weekly Chart as of November 24, 2017

Notes:
1. Volume is a big check. With such number of participants, you can trade in and out of this stock.
2. We want price to not slide past 9.89 from here on. At best, price should break the 13.56 level.
3. CCIs are well above zero level and are pointing up. Adds confidence on momentum-wise.
4. RSI is ranging around 70 level. May it be kept that way or better move to higher levels.
5. We want Slow Stochastic to remain above 80. Should it fail, then we can consider standing on the sidelines. We want that Fast Stochastic to turn up (entry/re-entry opportunity) and rise to higher levels.
6. Warning: this is a weekly chart and such requires a week long market activity to feel the sentiment of the market.


Mind the levels. Manage the risks. Protect your capital. Protect your gains.

DISCLAIMER: This is my unsolicited Point of View and is _not_ a recommendation to buy/sell the security. *** DO NOT *** attempt to trade unless you FULLY understand the associated (financial/emotional) risks and you FULLY accept responsibility of the results of your actions.

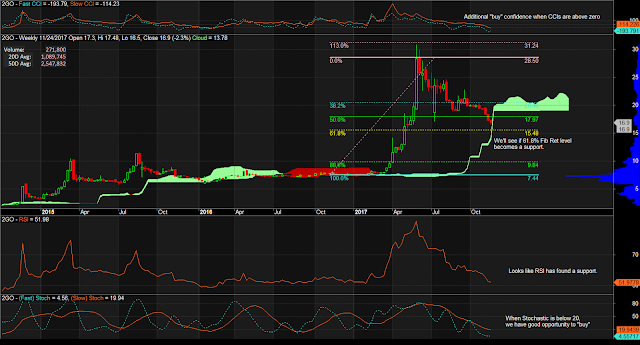
$2GO Study 20171124

$2GO Weekly Chart as of November 24, 2017

Note: Please see image for details.


Mind the levels. Manage the risks. Protect your capital. Protect your gains.

DISCLAIMER: This is my unsolicited Point of View and is _not_ a recommendation to buy/sell the security. *** DO NOT *** attempt to trade unless you FULLY understand the associated (financial/emotional) risks and you FULLY accept responsibility of the results of your actions.

$URC Study 20171124

$URC Monthly Chart as of November 24, 2017


Notes: This study is for "Long-term" investors. Please see image for details.


Mind the levels. Manage the risks. Protect your captial. Protect your gains.

DISCLAIMER: This is my unsolicited Point of View and is _not_ a recommendation to buy/sell the security. *** DO NOT *** attempt to trade unless you FULLY understand the associated (financial/emotional) risks and you FULLY accept responsibility of the results of your actions.


Thursday, November 23, 2017

$WLCON Study 20171123

$WLCON Daily Chart as of November 23, 2017


see image for more information.

Mind the levels. Manage the risks.

DISCLAIMER: This is my unsolicited Point of View and is _not_ a recommendation to buy/sell the security. *** DO NOT *** attempt to trade unless you FULLY understand the associated (financial/emotional) risks and you FULLY accept responsibility of the results of your actions.

$STI Study 20171123

$STI Daily Chart as of November 23, 2017


Notes:
1. Still on an uptrend.
2. CCIs are where we want them to be: rising above zero.
3. RSI is rising and above 50.
4. We want Slow Stochastic to turn up.

Mind the levels. Manage the risks.

DISCLAIMER: This is my unsolicited Point of View and is _not_ a recommendation to buy/sell the security. *** DO NOT *** attempt to trade unless you FULLY understand the associated (financial/emotional) risks and you FULLY accept responsibility of the results of your actions.

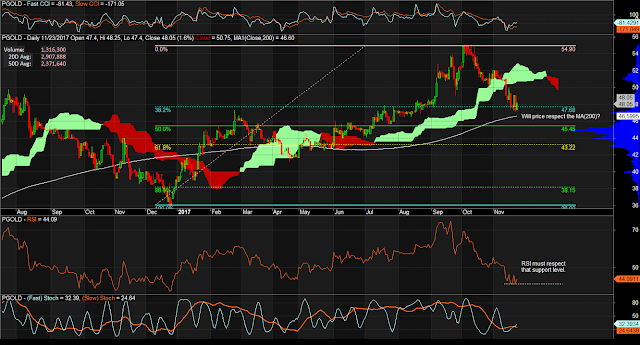
$PGOLD Study 20171123

$PGOLD Daily Chart as of November 23, 2017


Notes:
1. Trading near 200-day Moving Average.
2. CCIs must continue to rise.
3. RSI must continue respecting that support level.
4. Stochastics must rise and stay above 20.


Mind the levels. Manage the risks.

DISCLAIMER: This is my unsolicited Point of View and is _not_ a recommendation to buy/sell the security. *** DO NOT *** attempt to trade unless you FULLY understand the associated (financial/emotional) risks and you FULLY accept responsibility of the results of your actions.

$PLC Study 20171123

$PLC Daily Chart as of November 23, 2017


Notes:
1. 128 trades involving 1.3M+ shares (25% of the 20-day Volume average). Net Foreign of 121,960.
2. CCI are pointing up. Must cross over zero.
3. RSI is rising. Must respect the trend line support and cross over 50.
5. Stochastics must rise and stay above 20.


Mind the levels. Manage the risks.

DISCLAIMER: This is my unsolicited Point of View and is _not_ a recommendation to buy/sell the security. *** DO NOT *** attempt to trade unless you FULLY understand the associated (financial/emotional) risks and you FULLY accept responsibility of the results of your actions.

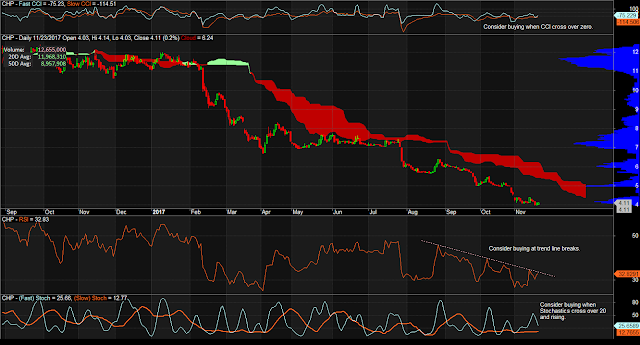
$CHP Study 20171123

$CHP Daily Chart as of November 23, 2017

$CHP Daily Chart as of November 23, 2017


Notes:
1. 410 trades involving  12.65M+ shares (higher than both 20-day and 50-day volume averages. Net foreign of -538,710.
2. CCIs are rising. We want them to cross over zero.
3. RSI is attempting for the fourth time to break out of the trend line resistance.
4. Stochastics need to turn up and stay above 20.

Mind the levels. Manage the risks.

DISCLAIMER: This is my unsolicited Point of View and is _not_ a recommendation to buy/sell the security. *** DO NOT *** attempt to trade unless you FULLY understand the associated (financial/emotional) risks and you FULLY accept responsibility of the results of your actions.


$SCC Study 20171123

$SCC Daily Chart as of November 23, 2017


Notes:
1. Trading around 50% Fib Ret level. 463 transactions involving  2,228,600 shares (79% of 20-day Volume average. Net Foreign is a huge -48,794,000.
2. CCIs are rising.
3. RSI has crossed over a trend line support.
4. Both Stochastics are under 20. Must rise and cross over 20.

Mind the levels. Manage the risks.

DISCLAIMER: This is my unsolicited Point of View and is _not_ a recommendation to buy/sell the security. *** DO NOT *** attempt to trade unless you FULLY understand the associated (financial/emotional) risks and you FULLY accept responsibility of the results of your actions.
Wednesday, November 22, 2017

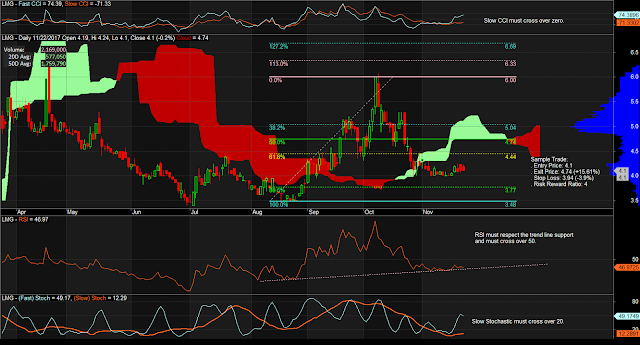
$LMG Study 20171122

$LMG Daily Chart as of November 22, 2017


Notes:
1. Volume is almost 4 times the 20-day volume average, almost 1.3 times the 50-day.
2. Fast CCI is above zero. Slow CCI must cross zero to add confidence.
3. RSI is rising. Must respect that trend line resistance and cross 50.
4. Slow Stochastic must cross 20 to add confidence.
5. Sample Trade

  • Entry Price: 4.1
  • Exit Price: 4.74 (+15.61%)
  • Stop Loss: 3.94 (-3.9%)
  • Risk Reward Ratio: 4

Mind the levels. Manage the risks.

DISCLAIMER: This is my unsolicited Point of View and is _not_ a recommendation to buy/sell the security. *** DO NOT *** attempt to trade unless you FULLY understand the associated (financial/emotional) risks and you FULLY accept responsibility of the results of your actions.


$RLC Study 20171122

$RLC Daily Chart as of November 22, 2017


Notes:
1. Today's Volume exceeds that of 20-day and 50-day Volume average.
2. CCIs are rising and must cross over zero.
3. RSI has turned up and must continue to rise past 50.
4. Fast Stochastic is above 20 and must continue rising. Slow Stochastic must turn up and rise above 20.
5. Sample Trade

  • Entry Price: 24.3
  • Exit Price: 27 (+11.11%)
  • Stop Loss: 23.4 (-3.7%)
  • Risk Reward Ratio: 3

Mind the levels. Manage the risks.

DISCLAIMER: This is my unsolicited Point of View and is _not_ a recommendation to buy/sell the security. *** DO NOT *** attempt to trade unless you FULLY understand the associated (financial/emotional) risks and you FULLY accept responsibility of the results of your actions.


$PXP Study 20171122

$PXP Daily Chart as of November 22, 2017


Notes:
1. Volume turn over is almost six times the 20-day Volume average.
2. Price drop is a almost similar to Sep 26th.
3. I'm seeing a price channel and the mid-point of that channel appears to be critical to trading.
4. A revisit to the lower end of the channel for me is logical.

Market decides where the money goes. Always have the guts to execute your stop loss. Mind the levels. Manage the risks.
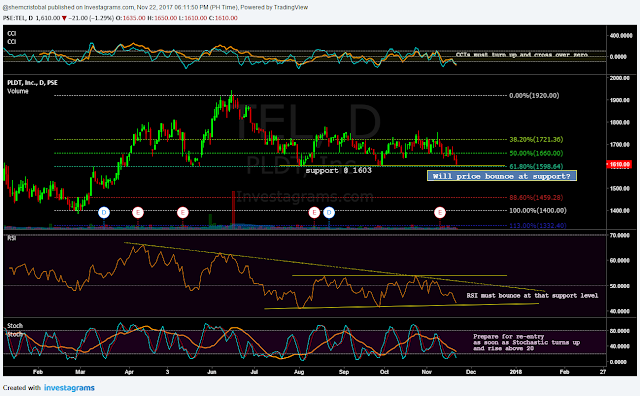
$TEL Study 20171122

$TEL Daily Chart as of November 22, 2017

See notes at the image.

Tuesday, November 21, 2017

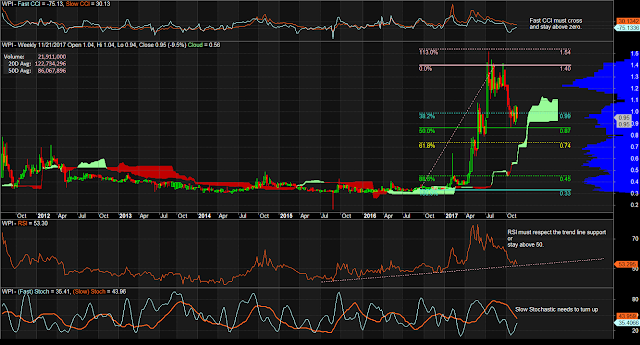
$WPI Study 20171121

$WPI Weekly Chart as of November 21, 2017

Notes:
1. Daily chart suggests $WPI is being traded within a range. Weekly chart offers a different perspective.
2. We wait on Fast CCI crossing zero level.
3. We wait on RSI bouncing at that trend line support (or the 50 level).
4. We wait on Slow Stochastic to turn up and rise.
5. Although note seen on the chart, 0.86 is where a 50-day Exponential Moving Average lies.

Mind the levels. Manage the risks.

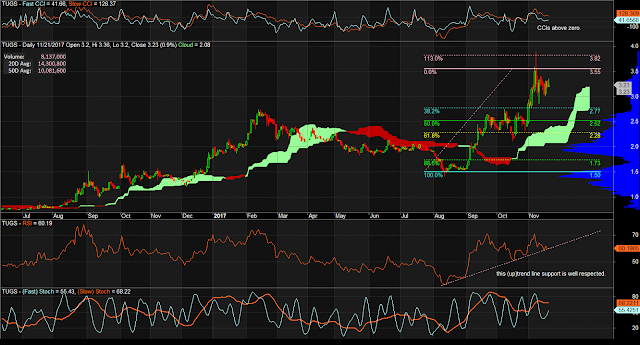
$TUGS Study 20171121

$TUGS Daily Chart as of November 21, 2017


Notes:
1. 52-week high is around 17% from current traded price.
2. Trading above the clouds.
3. RSI formation suggests 70 level will be re-tested. A break out at this level is highly favorable.

Mind the levels. Manage the risks.

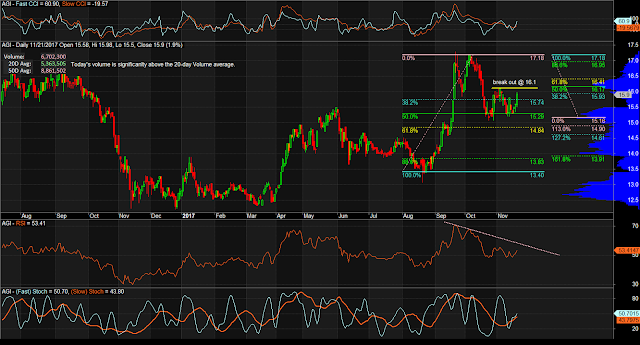
$AGI Study 20171121

$AGI Daily Chart as of November 21, 2017


Notes:
1. Price approaching a break out level. Today's volume is significantly higher than the 20-day Volumen average.
2. CCIs rising.
3. RSI above 50. Must break that trend line resistance.
4. Stochastics rising.

Mind the levels. Manage the risks.

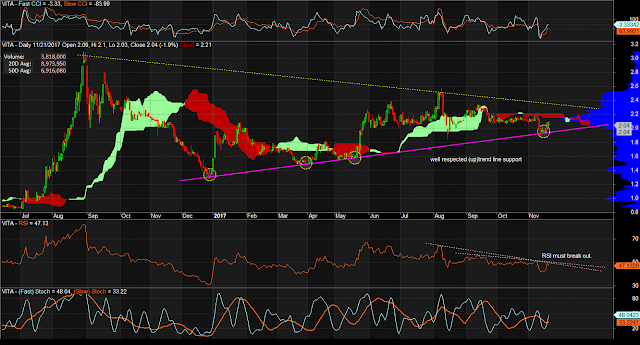
$VITA Study 20171121


$VITA Daily Chart as of November 21, 2017


Notes
1. That (up)trend line support is very much respected.
2. RSI must break out to provide us further entry confidence.
3. Thin Kumo must be easy to pass thru although.

Mind the levels. Manage the risks.

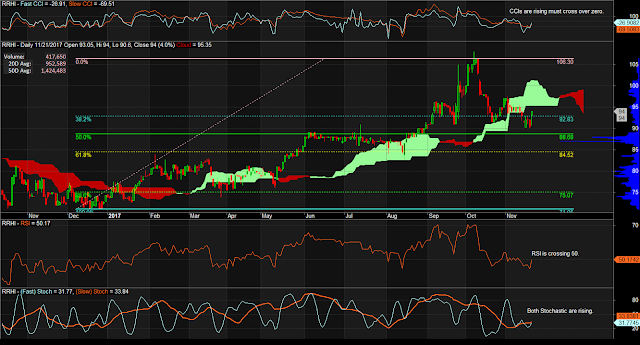
$RRHI Study 20171121

$RRHI Daily Chart as of November 21, 2017


Note: $RRHI is one of the top buy recommendations from BPITrade Research Team with target price of 105. COL Financial investment guide has 107 at its Fair Value.

Mind the levels. Manage the risks.

$PHES Study 20171121

$PHES Daily Chart as of November 21, 2017


Notes:
1. 32 trades. 1.26M shares (very low compared to 20-day Volume average).
2. CCIs rising. Must cross zero.
3. RSI rising. Must cross 50.
4. Stochastic must continue rising.
5. Best to trade during break out.

Mind the levels. Manage the risks.

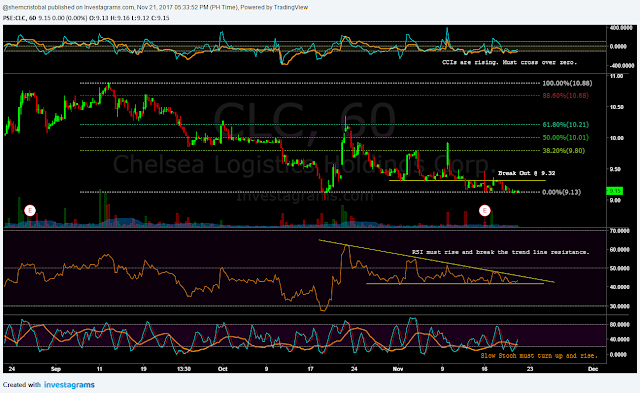
$CLC Study 20171121

$CLC Hourly Chart as of November 21, 2017


Notes:
1. With reference to Nov. 16 reading of $CLC, we are now waiting for RSI to make the expected move up.
2. 277 trades today. 799K+ shares (not even half the 20-day Volume average).
3. CCIs are rising. Must cross over zero.
4. RSI is stil below 50.
5. Waiting for Slow Stochastic to turn up and rise.
6. Best entry is at break out level. Those with appetite for high risks may enter.

Mind the levels. Manage the risks.

$ION Study 20171121

$ION Daily Chart as of November 21, 2017


Notes:
1. 193 trades. 1.74M+ shares.
2. Trading above the Kumo.
3. CCIs above zero and rising.
4. RSI above 50 and rising.
5. Stochastics above 20 and rising.

Mind the levels. Manage the risks.

Monday, November 20, 2017

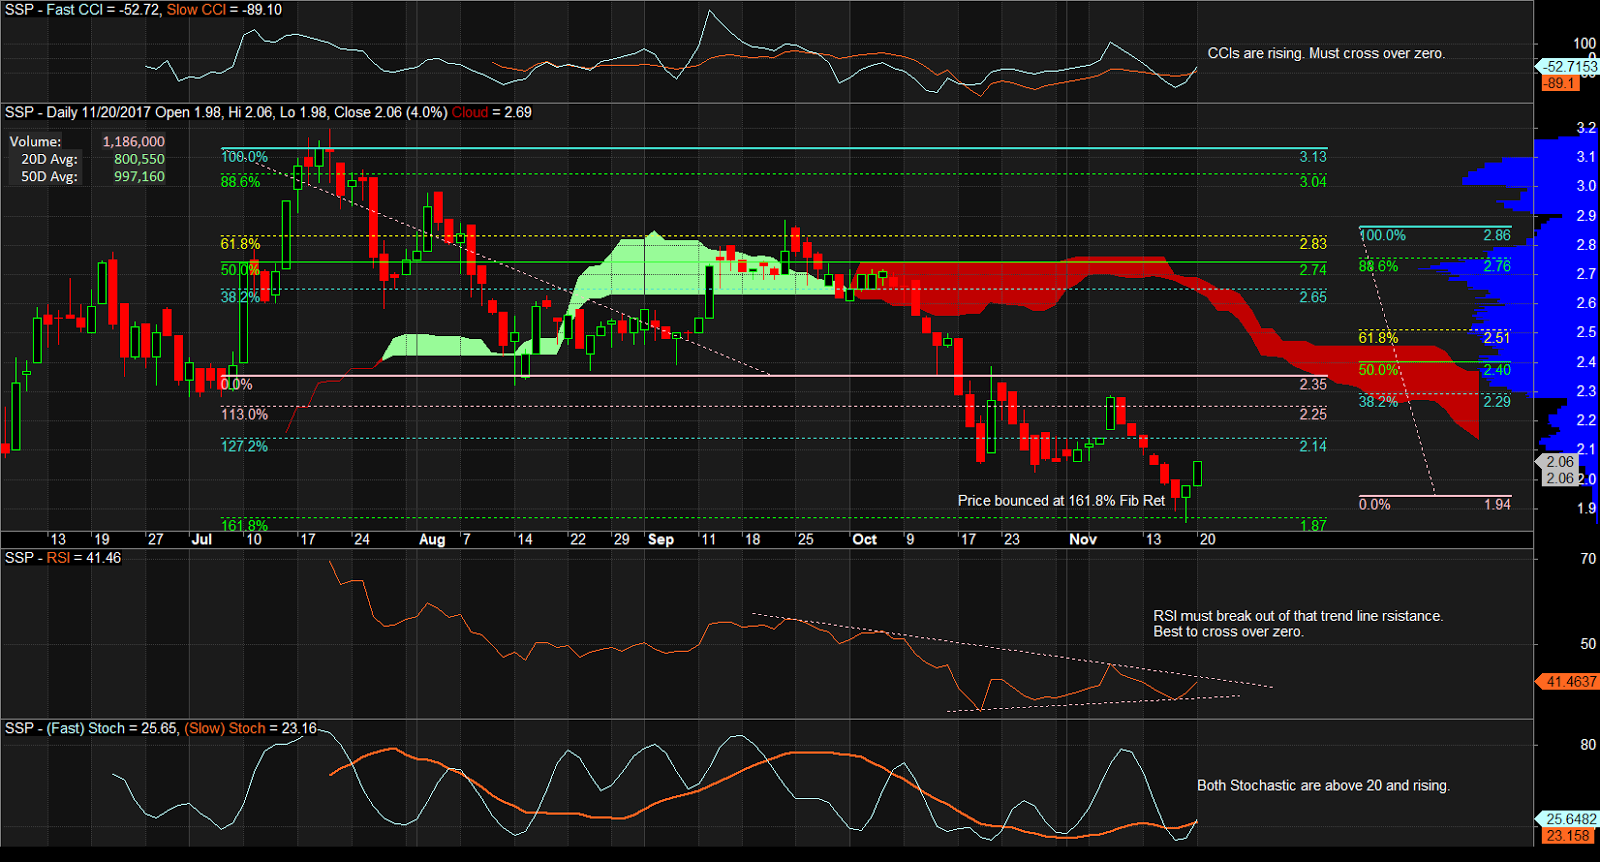
$SSP Study 20171120

$SSP Daily Chart as of November 20, 2017


Notes:
1. Price bounced at the 161.8% Fib Ret level.
2. 44 trades. 1.18M+ shares (1.48 times the 20-day Volume Average).
3. CCIs are rising. Must cross over zero.
4. RSI is rising. Must break out of that trend line resistance or cross over 50.
5. Both Stochastic must continue rising above 20.

Sample Trade:

  • Entry Price: 2.06
  • Exit Price: 2.51 (+21.84%)
  • Stop Loss: 1.98 (-3.88%)
  • Risk Reward Ratio: 5.63


Mind the levels. Manage the risks.

$CEB Study 20171120

$CEB Daily Chart as of November 20, 2017


Notes
1. 499 trades. 179K shares. Up by 3.09% today.
2. CCIs pointing up. Must cross over zero.
3. RSI is rising. Must cross over 50 and break that trend line resistance.
4. Both Stochastic must continue rising above 20.

Sample Trade

  • Entry Price: 103.5
  • Exit Price: 112.5 (+8.7%)
  • Stop Loss: 99.45 (-3.91%)
  • Risk Reward Ratio: 2.25


Mind the levels. Manage the risks.

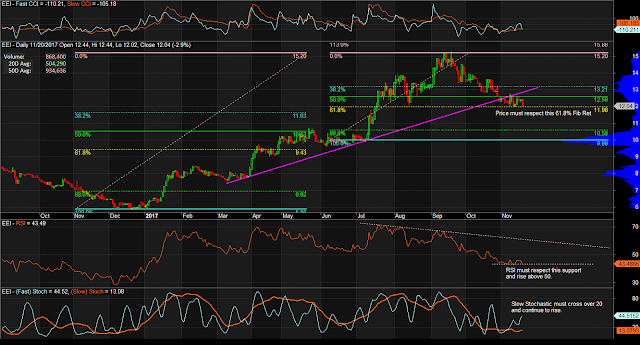
$EEI Study 20171120

$EEI Daily Chart as of November 20, 2017


Notes:
1. 173 trades; 868K+ shares (1.72 times the 20-day Volume Average).
2. Trading near that 61.8% Fib Ret level.
3. That price trend line support has been violated.
4. CCI must cross over zero.
5. RSI must respect that support level or cross over 50.
6. Slow Stochastic must cross over 20 and continue to rise.

Sample Trade

  • Entry Price: 12.04
  • Exit Price: 15.2 (+26.2%)
  • Stop Loss: 11.57 (-3.9%)
  • Risk Reward Ratio: 6.72


Mind the levels. Manage the risks.

$BPI Study 20171120

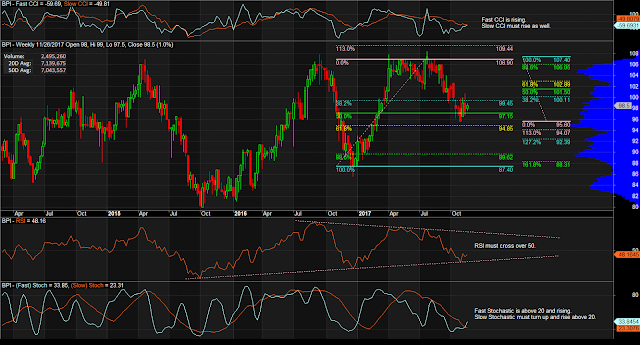
$BPI Weekly Chart as of November 20, 2017


Notes:
1. Price appears to be respecting that 50% Fib Ret level as a support.
2. We want Slow CCI to rise above zero level.
3. We want RSI to continue rising past 50 and over that trend line resistance.
4. We want Slow Stochastic to turn up and continue to rise above 20.

Sample Trade

  • Entry Price: 98.5
  • Exit Price: 106.9 (+8.5%)
  • Stop Loss: 95.15 (-3.4%)
  • Risk Reward Ratio: 2.51


Mind the levels. Manage the risks.

$CEI Study 20171120

$CEI Daily Chart as of November 20, 2017

Notes:
1. Closed at 0.2060 with 10.64M shares (just a little over the 20-day Volume average) in 118 trades.
2. We want CCI to be above zero level.
3. We want RSI to cross over 50 level.
4. We want Stochastic to continue to rise.

Mind the levels. Manage the risks.

Saturday, November 18, 2017

$MRC Study 20171117

$MRC Daily Chart as of November 17, 2017


Notes:
1. 434 trades last Nov 17th with 38.54M+ shares (1.429 times the 20-day Volume Average). Net Foreign of 83.7K+ .
2. Trading at 38.2% Fit Ret level. Up trend is still in tact.
3. CCI above zero level.
4. RSI broke that trend line resistance and now above 50 level. Must break the new resistances.
5. Both Stochastic are rising.

Mind the levels. Manage the risks.

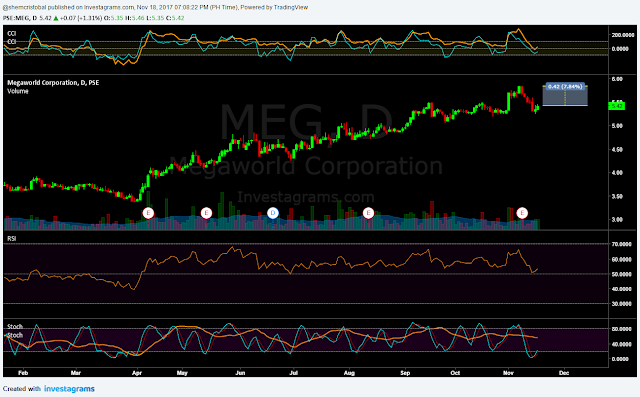
$MEG Study 20171117

$MEG Daily Chart as of November 17, 2017


Notes:
1. The 1,640 trades amounts to 34.29M+ shares (1.14 times the 20-day Volume Average). Net Foreing is at 98.17M+!
2. CCI turned up.
3. RSI bounced at 50 level.
4. (Fast) Stoch crossed over 20 level.
5. As the overall trend is in good shape, should you decide to acquire this stock  at 5.36, there is high probability of earning at least 6%.

Mind the levels. Manage the risks.

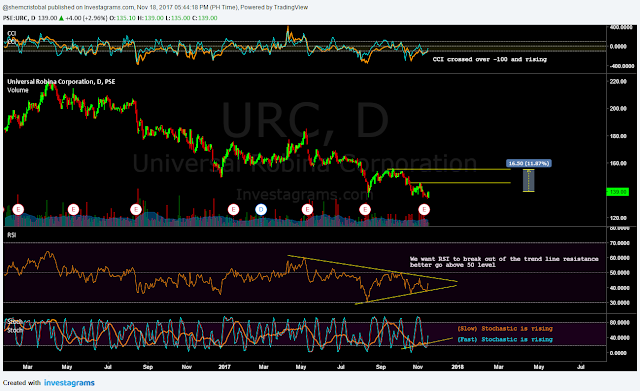
$URC Study 20171117

$URC Daily Chart as of November 17, 2017


Notes:
1. The 1427 trades generated 794K+ shares (just 59% of the 20-day Volume average). Net Foreign of 15.26M+.
2. CCI crossed -100 level (very high risk buy signal).
3. RSI respecting that trend line support. Must break out of the trend line resistance to provide us condifence (and a high risk buy signal).
4. (Slow) Stochastic is steadily rising versus a quick rise of (Fast) Stochastic.
5. Should BULLs continue to dominate, 11.87% return is at stake.

Mind the levels. Manage the risks.

$GERI Study 20171117

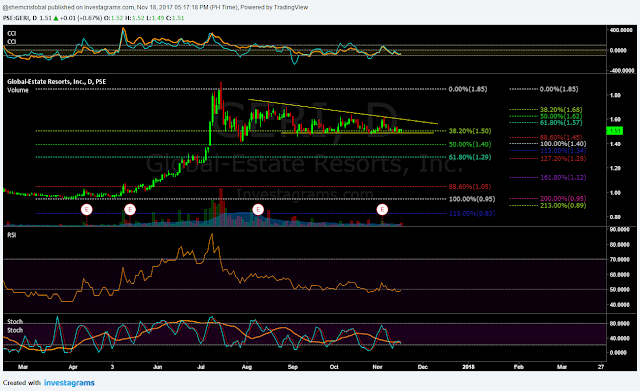
$GERI Daily Chart as of November 17, 2017


Notes:
1. Nov 17 witnessed 128 trades amounting to 10M+ shares (which is 1.67 times the 20-day Volume average). Net Foreign buying of 2.85M+.
2. Either a triangle structure is in place or a consolidation box. Either way 38.2% Fib Ret level appears to be a strong support zone.
3. CCI is above -100 level and pointing up. Favorable when it cross (buy signal) zero level.
4. RSI is oscillating at 50 level. Must break out (buy signal) and rise up.
5. Stochastics are near 20 level. Must turn up (buy signal) and continue to rise.


Mind the levels. Manage the risks.

$FLI Study 20171117

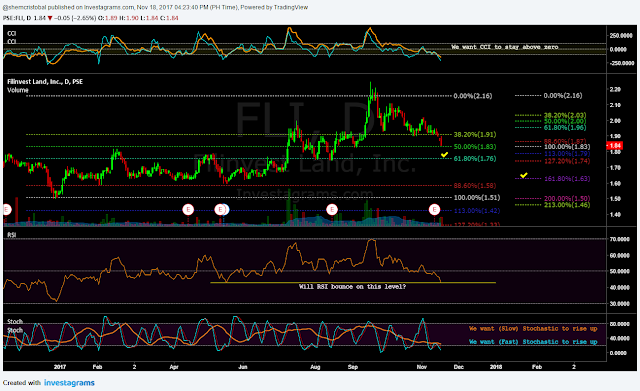
$FLI Daily Chart as of November 17, 2017


Notes:
1. If you have seen the $FLI Weekly Chart drawn last Nov. 16, you can surmise that $FLI is now being traded in a trend line support.
2. There were 386 trades last Nov. 17 amounting to 31.37M shares (which is 2.63 times the 20-day volume average). Net Foreign is at 4.69M!
3. Should BEARs continue to dominate, we might see that 61.8% Fib Ret level. Worse that 161.8% Fib Ret level.
4. We may consider buying when CCI turns up. Better when it crosses -100 level.
5. We want RSI to bounce on that level and consider buying when RSI crosses 50 level.
6. Both Stochastic indicators are near 20 level. As they turn up, we may consider buying.

Mind the levels. Manage the risks.

Friday, November 17, 2017

$BLOOM Study 20171117

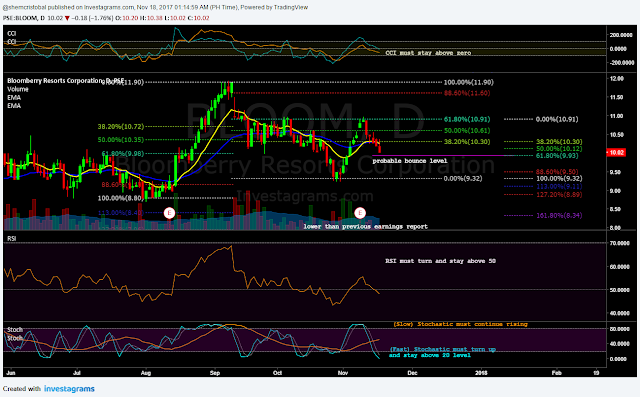
$BLOOM Daily Chart as of November 17, 2017


Notes:
1. Traded 1,257 times with 5.16M shares (just 35% of the 20-day volume average).
2. Price is heading the thought of bounce level.
3. CCI must turn up and go past zero level.
4. RSI must turn up and go past 50 level.
5. (Slow) Stochastic must continue rising with (Fast) Stochastic turning and crossing over 20 level.

Mind the levels. Manage the risks.

$IMI Study 20171117

$IMI Hourly Chart as of November 17, 2017


Notes
1. 1,713 trades amounting to 3.9M shares (87% of the 20-day volume average).
2. Price appears to be bouncing at 61.8% Fib Ret level.
2. CCI turning up.
3. RSI turning up.
4. Stochastic under 20 and turning up.

Mind the levels. Manage the risks.

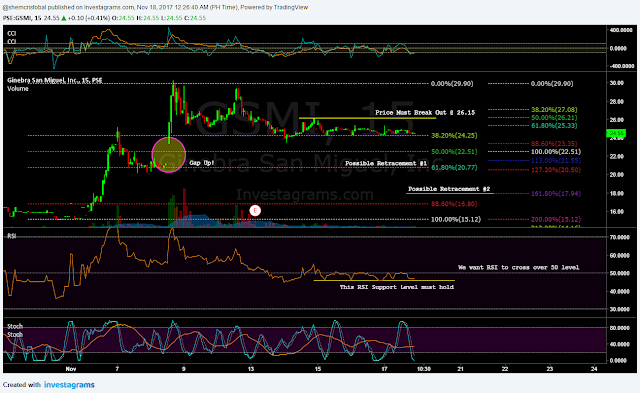
$GSMI Study 20171117

$GSMI 15-Minute Chart as of November 17, 2017


Notes:
1. Traded 148 times with only 271K+ shares (This volume is just 13% of the average in the past 20 days).
2. Gap up must be filled and might drop to 61.8% level or that 161.8% level of the other Fib Ret.
3. RSI is being held at that support. We want RSI to cross and stay above 50.

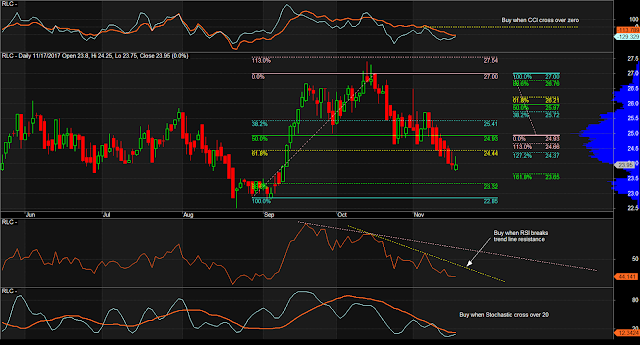
$RLC Study 20171117

$RLC Daily Chart as of November 17, 2017

Notes:
1. Volume of 4.259M shares (2.59 times the 20-day volume average). 720 transactions today.
2. (Fast) CCI is rising. (Very) High Risk buy when it crosses over -100.
3. RSI is turning up. (Very) High Risk buy when it breaks that trend line resistance.
4. Stochastic below 20. (Very) High Risk buy when it crossed over 20.

Mind the levels. Manage the risks.

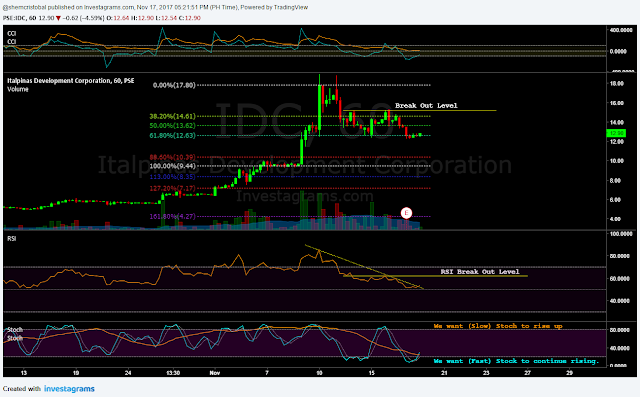
$IDC Study 20171117

$IDC Hourly Chart as of November 17, 2017


Notes:
1. Trading at 61.8% Fib Ret level. must hold this as support and break out of that level.
2. CCI must move towards and stay above zero level.
3. RSI broke that trend line resistance. Must continue rising and break out of that level.
4. (Fast) Stochastic crossed over 20 level and rising. We want (Slow) Stochastic doing the same.

Mind the levels, manage the risks.


Thursday, November 16, 2017

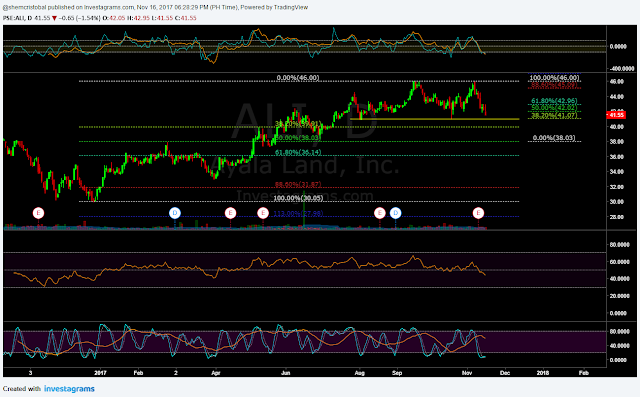
$ALI Study 20171116

$ALI Daily Chart as of November 16, 2017


Notes:
1. Price is approaching a Fib Ret level (and a previous bounce level). Are we expecting a bounce here?
2. CCI below -100 and pointing down.
3. RSI below 50 and pointing down.
4. (Slow) Stochastic is pointing down but while (Fast) Stochastic is below 20 level it has turned (must break out of 20 level though).

Mind the levels, manage the risks.

$CHP Study 20171116

$CHP Daily Chart as of November 20, 2017
$CHP Daily Chart as of November 16, 2017


Notes: (Due to the breadth of the price chart, other indicators are not visible to allow price chart readability.)
1. Prices appears to be consolidating again. Yes again. This time at 188.6% level (never heard this level before).
2. CCIs are pointing up.
3. RSI broke out of 30 level. Must continue to rise.
4. (Slow) Stochastic still below 20 level. (Fast) Stochastic is above 20 level and rising.

Mind the levels, manage the risks.

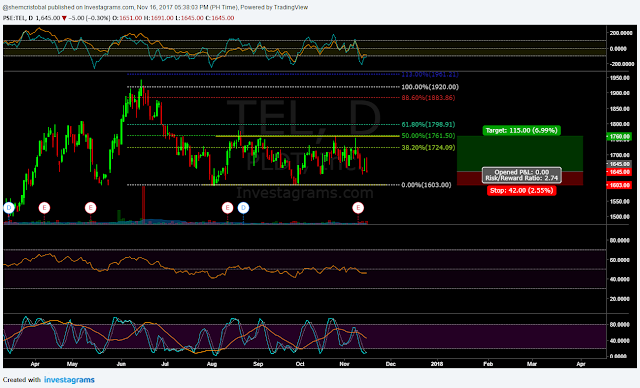
$TEL Study 20171116

$TEL Daily Chart as of November 16, 2017


Notes:
1. Price is ranging, buy on dips.
2. CCI must cross -100.
3. RSI must rise above.
4. (Fast) Stochastic is suggesting a buy although (Slow) Stochastic is diving.

Mind the levels, manage the risks.

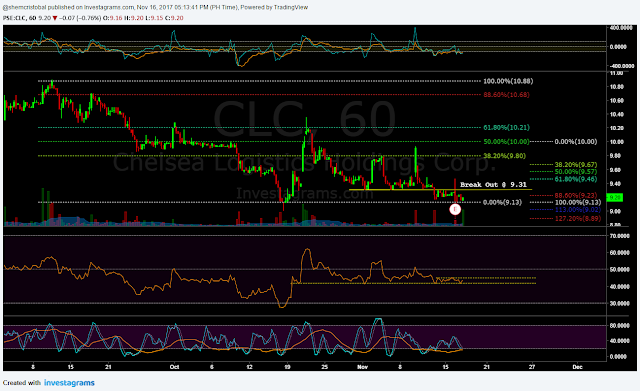
$CLC Study 20171116

$CLC Hourly Chart as of November 16, 2017


Notes:
1. Price trading near previous low point. 9.31 is the price to break.
2. CCI under -100 level. Must rise up and stay above zero level.
3. RSI being held at a support level. Must rise up and break 50 level.
4. (Slow) Stochastic is under 20 level and rising. Must continue to rise along with the (Fast) Stochastic.

Mind the levels, manage the risks.