 |
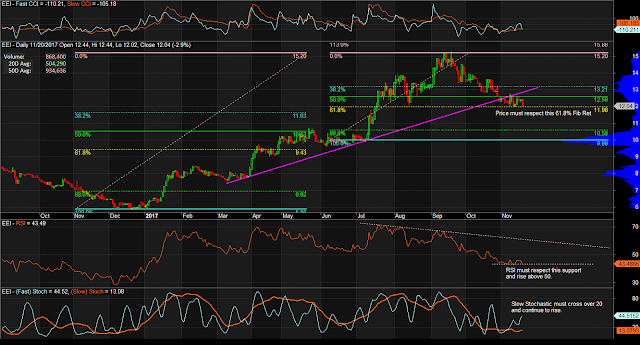
| $EEI Daily Chart as of November 20, 2017 |
Notes:
1. 173 trades; 868K+ shares (1.72 times the 20-day Volume Average).
2. Trading near that 61.8% Fib Ret level.
3. That price trend line support has been violated.
4. CCI must cross over zero.
5. RSI must respect that support level or cross over 50.
6. Slow Stochastic must cross over 20 and continue to rise.
Sample Trade
- Entry Price: 12.04
- Exit Price: 15.2 (+26.2%)
- Stop Loss: 11.57 (-3.9%)
- Risk Reward Ratio: 6.72
Mind the levels. Manage the risks.
No comments:
Post a Comment