 |
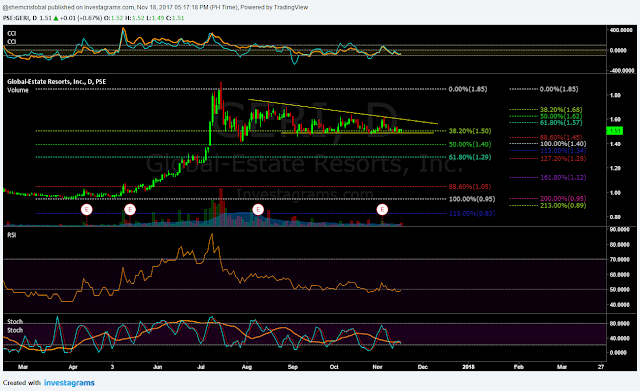
| $GERI Daily Chart as of November 17, 2017 |
Notes:
1. Nov 17 witnessed 128 trades amounting to 10M+ shares (which is 1.67 times the 20-day Volume average). Net Foreign buying of 2.85M+.
2. Either a triangle structure is in place or a consolidation box. Either way 38.2% Fib Ret level appears to be a strong support zone.
3. CCI is above -100 level and pointing up. Favorable when it cross (buy signal) zero level.
4. RSI is oscillating at 50 level. Must break out (buy signal) and rise up.
5. Stochastics are near 20 level. Must turn up (buy signal) and continue to rise.
Mind the levels. Manage the risks.
No comments:
Post a Comment