 |
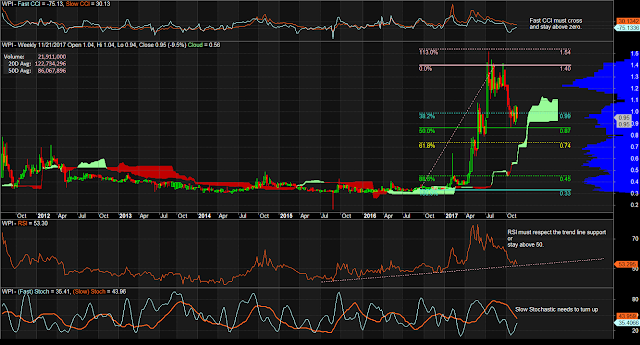
| $WPI Weekly Chart as of November 21, 2017 |
Notes:
1. Daily chart suggests $WPI is being traded within a range. Weekly chart offers a different perspective.
2. We wait on Fast CCI crossing zero level.
3. We wait on RSI bouncing at that trend line support (or the 50 level).
4. We wait on Slow Stochastic to turn up and rise.
5. Although note seen on the chart, 0.86 is where a 50-day Exponential Moving Average lies.
Mind the levels. Manage the risks.
No comments:
Post a Comment