 |
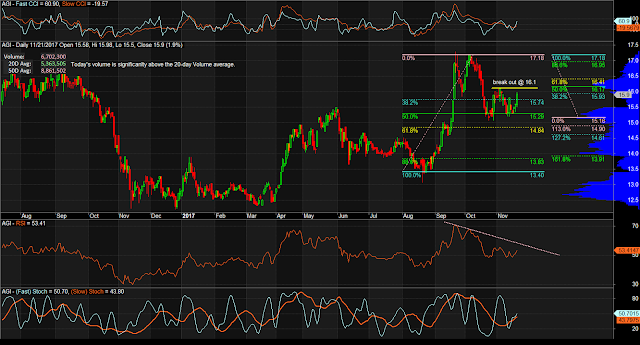
| $AGI Daily Chart as of November 21, 2017 |
Notes:
1. Price approaching a break out level. Today's volume is significantly higher than the 20-day Volumen average.
2. CCIs rising.
3. RSI above 50. Must break that trend line resistance.
4. Stochastics rising.
Mind the levels. Manage the risks.
No comments:
Post a Comment