 |
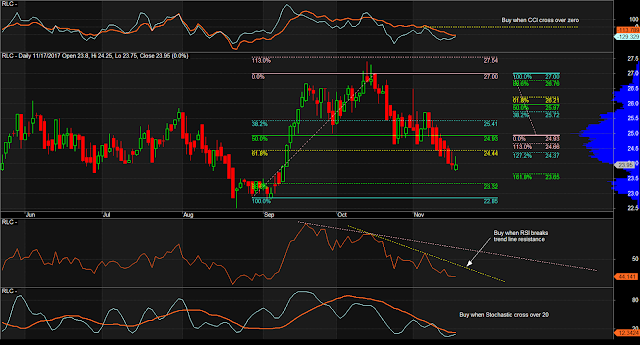
| $RLC Daily Chart as of November 17, 2017 |
Notes:
1. Volume of 4.259M shares (2.59 times the 20-day volume average). 720 transactions today.
2. (Fast) CCI is rising. (Very) High Risk buy when it crosses over -100.
3. RSI is turning up. (Very) High Risk buy when it breaks that trend line resistance.
4. Stochastic below 20. (Very) High Risk buy when it crossed over 20.
Mind the levels. Manage the risks.
No comments:
Post a Comment