Disclaimer


This is my unsolicited Point of View and is _not_ a recommendation to buy/sell the security.

*** DO NOT *** attempt to trade unless you FULLY understand the associated (financial/emotional) risks and you FULLY accept responsibility of the results of your actions.

Mind the levels. Manage the risks. Protect your capital. Protect your gains.

Keywords

StudyList (20) $PXP (12) BULLishStocks (10) $BRN (8) $TEL (8) $X (8) $BLOOM (7) $CHP (7) $CPG (7) $MRC (7) $URC (7) $APX (6) $CEI (6) $FLI (6) $JFC (5) $SGI (5) $WPI (5) $BHI (4) $CLC (4) $GERI (4) $MPI (4) $RLC (4) BobbyAxelRod (4) $ACR (3) $AGI (3) $BEL (3) $CROWN (3) $CYBR (3) $DD (3) $DNL (3) $FGEN (3) $MAXS (3) $MBT (3) $MEG (3) $MWC (3) $NOW (3) $PCOR (3) $PGOLD (3) $PLC (3) $RFM (3) $SCC (3) $SMPH (3) $TUGS (3) $VITA (3) PSEIndex (3) TopWeeklyGainersLosers (3) $ATN (2) $BDO (2) $BPI (2) $COSCO (2) $DMC (2) $EEI (2) $EMP (2) $IMI (2) $ION (2) $JGS (2) $LR (2) $LRW (2) $MED (2) $MRP (2) $MWIDE (2) $PHEN (2) $PIP (2) $ROCK (2) $RRHI (2) $SHLPH (2) $SSI (2) $STI (2) $T (2) $WEB (2) $WLCON (2) Above200dayMA (2) TopMonthlyGainersLosers (2) $2GO (1) $ABS (1) $AEV (1) $ALI (1) $ANI (1) $AT (1) $BSC (1) $CNPF (1) $COAL (1) $EW (1) $FNI (1) $FOOD (1) $FPH (1) $GSMI (1) $GTCAP (1) $HOUSE (1) $IDC (1) $LMG (1) $LTG (1) $MER (1) $MRSGI (1) $NIKL (1) $ORE (1) $PHES (1) $PIZZA (1) $POPI (1) $PPC (1) $PX (1) $ROX (1) $RWM (1) $SMC (1) $SSP (1) $VUL (1) NetForeign (1) TechnicalAnalysis (1) Volx5DAvg (1)

Monday, November 13, 2017

$BHI Study 20171113

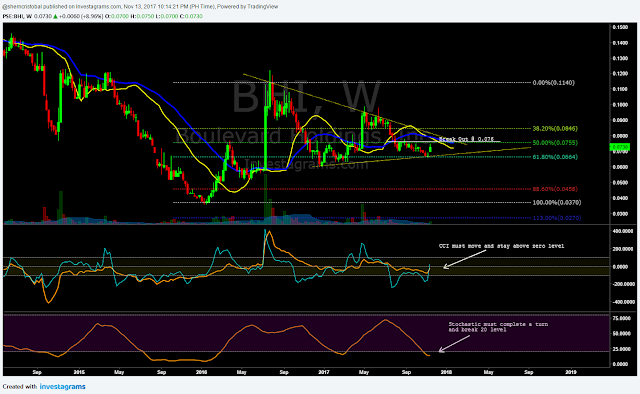
$BHI Weekly Chart as of November 13, 2017


Notes:
1. Price must break out of 0.076 level. and eventually break out of that trend line resistance.
2. Yellow MA must cross over Blue MA.
3. CCI must move and stay above zero level.
4. Stochastic must turn up and break out of 20 level.

Mind the levels, manage the risks.

No comments:

Post a Comment