 |
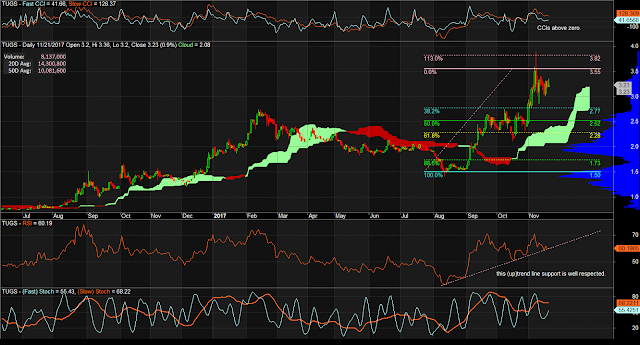
| $TUGS Daily Chart as of November 21, 2017 |
Notes:
1. 52-week high is around 17% from current traded price.
2. Trading above the clouds.
3. RSI formation suggests 70 level will be re-tested. A break out at this level is highly favorable.
Mind the levels. Manage the risks.
No comments:
Post a Comment