Disclaimer


This is my unsolicited Point of View and is _not_ a recommendation to buy/sell the security.

*** DO NOT *** attempt to trade unless you FULLY understand the associated (financial/emotional) risks and you FULLY accept responsibility of the results of your actions.

Mind the levels. Manage the risks. Protect your capital. Protect your gains.

Keywords

StudyList (20) $PXP (12) BULLishStocks (10) $BRN (8) $TEL (8) $X (8) $BLOOM (7) $CHP (7) $CPG (7) $MRC (7) $URC (7) $APX (6) $CEI (6) $FLI (6) $JFC (5) $SGI (5) $WPI (5) $BHI (4) $CLC (4) $GERI (4) $MPI (4) $RLC (4) BobbyAxelRod (4) $ACR (3) $AGI (3) $BEL (3) $CROWN (3) $CYBR (3) $DD (3) $DNL (3) $FGEN (3) $MAXS (3) $MBT (3) $MEG (3) $MWC (3) $NOW (3) $PCOR (3) $PGOLD (3) $PLC (3) $RFM (3) $SCC (3) $SMPH (3) $TUGS (3) $VITA (3) PSEIndex (3) TopWeeklyGainersLosers (3) $ATN (2) $BDO (2) $BPI (2) $COSCO (2) $DMC (2) $EEI (2) $EMP (2) $IMI (2) $ION (2) $JGS (2) $LR (2) $LRW (2) $MED (2) $MRP (2) $MWIDE (2) $PHEN (2) $PIP (2) $ROCK (2) $RRHI (2) $SHLPH (2) $SSI (2) $STI (2) $T (2) $WEB (2) $WLCON (2) Above200dayMA (2) TopMonthlyGainersLosers (2) $2GO (1) $ABS (1) $AEV (1) $ALI (1) $ANI (1) $AT (1) $BSC (1) $CNPF (1) $COAL (1) $EW (1) $FNI (1) $FOOD (1) $FPH (1) $GSMI (1) $GTCAP (1) $HOUSE (1) $IDC (1) $LMG (1) $LTG (1) $MER (1) $MRSGI (1) $NIKL (1) $ORE (1) $PHES (1) $PIZZA (1) $POPI (1) $PPC (1) $PX (1) $ROX (1) $RWM (1) $SMC (1) $SSP (1) $VUL (1) NetForeign (1) TechnicalAnalysis (1) Volx5DAvg (1)

Saturday, November 18, 2017

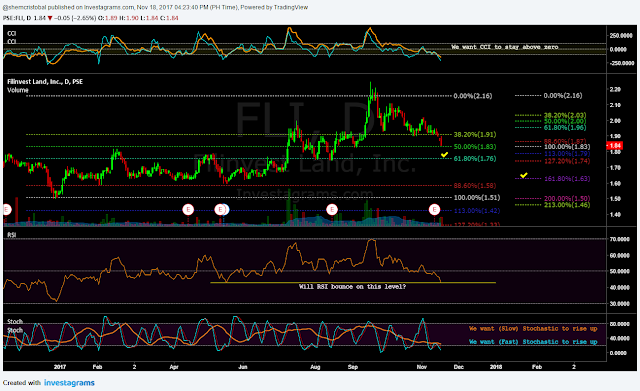
$FLI Study 20171117

$FLI Daily Chart as of November 17, 2017


Notes:
1. If you have seen the $FLI Weekly Chart drawn last Nov. 16, you can surmise that $FLI is now being traded in a trend line support.
2. There were 386 trades last Nov. 17 amounting to 31.37M shares (which is 2.63 times the 20-day volume average). Net Foreign is at 4.69M!
3. Should BEARs continue to dominate, we might see that 61.8% Fib Ret level. Worse that 161.8% Fib Ret level.
4. We may consider buying when CCI turns up. Better when it crosses -100 level.
5. We want RSI to bounce on that level and consider buying when RSI crosses 50 level.
6. Both Stochastic indicators are near 20 level. As they turn up, we may consider buying.

Mind the levels. Manage the risks.

No comments:

Post a Comment