Disclaimer


This is my unsolicited Point of View and is _not_ a recommendation to buy/sell the security.

*** DO NOT *** attempt to trade unless you FULLY understand the associated (financial/emotional) risks and you FULLY accept responsibility of the results of your actions.

Mind the levels. Manage the risks. Protect your capital. Protect your gains.

Keywords

StudyList (20) $PXP (12) BULLishStocks (10) $BRN (8) $TEL (8) $X (8) $BLOOM (7) $CHP (7) $CPG (7) $MRC (7) $URC (7) $APX (6) $CEI (6) $FLI (6) $JFC (5) $SGI (5) $WPI (5) $BHI (4) $CLC (4) $GERI (4) $MPI (4) $RLC (4) BobbyAxelRod (4) $ACR (3) $AGI (3) $BEL (3) $CROWN (3) $CYBR (3) $DD (3) $DNL (3) $FGEN (3) $MAXS (3) $MBT (3) $MEG (3) $MWC (3) $NOW (3) $PCOR (3) $PGOLD (3) $PLC (3) $RFM (3) $SCC (3) $SMPH (3) $TUGS (3) $VITA (3) PSEIndex (3) TopWeeklyGainersLosers (3) $ATN (2) $BDO (2) $BPI (2) $COSCO (2) $DMC (2) $EEI (2) $EMP (2) $IMI (2) $ION (2) $JGS (2) $LR (2) $LRW (2) $MED (2) $MRP (2) $MWIDE (2) $PHEN (2) $PIP (2) $ROCK (2) $RRHI (2) $SHLPH (2) $SSI (2) $STI (2) $T (2) $WEB (2) $WLCON (2) Above200dayMA (2) TopMonthlyGainersLosers (2) $2GO (1) $ABS (1) $AEV (1) $ALI (1) $ANI (1) $AT (1) $BSC (1) $CNPF (1) $COAL (1) $EW (1) $FNI (1) $FOOD (1) $FPH (1) $GSMI (1) $GTCAP (1) $HOUSE (1) $IDC (1) $LMG (1) $LTG (1) $MER (1) $MRSGI (1) $NIKL (1) $ORE (1) $PHES (1) $PIZZA (1) $POPI (1) $PPC (1) $PX (1) $ROX (1) $RWM (1) $SMC (1) $SSP (1) $VUL (1) NetForeign (1) TechnicalAnalysis (1) Volx5DAvg (1)

Sunday, October 8, 2017

$SHLPH Study 20171006

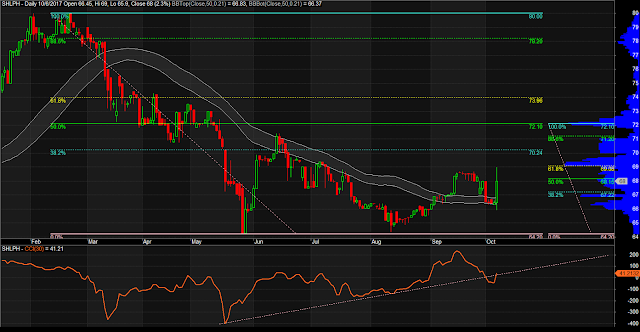
$SHLPH Daily Chart as of October 6, 2017

Notes:
1. CCI must stay above that trend line support.
2. Price must stay above 68.15, better to move past 69.08.
3. Can you see the presence of BULLish Divergence?

How do I create my charts? Explained here: https://drive.google.com/file/d/0B5SbOJpLxCy9YXM3cHVUY0ZYa0E/view

$T Study 20171006

$T Daily Chart as of October 6, 2017

Notes:
1. Presence of BULLish Divergence.
2. Price must stay above 1.26 and cross that trend line resistance.
3. CCI must stay above zero line or better stay above that trend line support.

How do I create my charts? Explained here: https://drive.google.com/file/d/0B5SbOJpLxCy9YXM3cHVUY0ZYa0E/view

$SMC Study 20171006

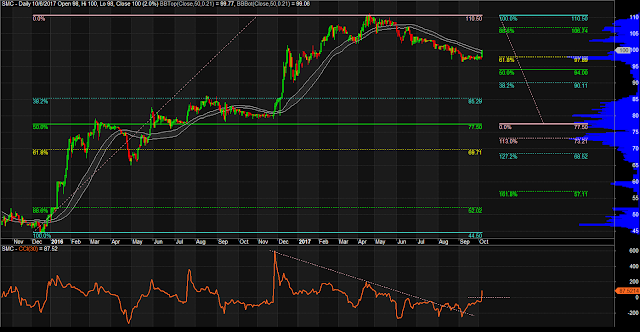
$SMC Daily Chart as of October 6, 2017

Notes:
1. CCI crossed zero line. Must stay above it.
2. Price bounced at that 61.8% Fib Ret level. If it holds above this one we can expect price at 88.6%

How do I create my charts? Explained here: https://drive.google.com/file/d/0B5SbOJpLxCy9YXM3cHVUY0ZYa0E/view
$MWC Study 20171006

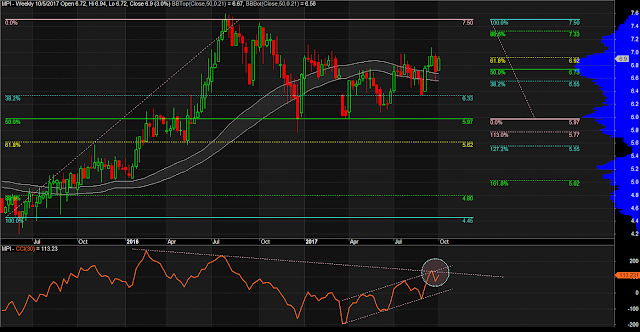
$MWC Weekly Chart as of October 6, 2017

Notes:
1. CCI breaking out of that trend line resistance. Must cross over zero line.
2. Price must move past 113%

How do I create my charts? Explained here: https://drive.google.com/file/d/0B5SbOJpLxCy9YXM3cHVUY0ZYa0E/view
StudyList 20171006

Share ko lang mga nagpapansin sa akin as of October 6th, 2017.


DISCLAIMER: ***strictly for STUDY purposes only*** DO NOT attempt to trade unless you fully understood the associated risks.


  1. $PHEN
  2. $CHP
  3. $SHLPH
  4. $T
  5. $SMC
  6. $MWC
  7. $ALI
  8. $EAGLE
  9. $PPC
  10. $PX
  11. $JGS

How do I create my charts? Explained here: https://drive.google.com/file/d/0B5SbOJpLxCy9YXM3cHVUY0ZYa0E/view