Disclaimer


This is my unsolicited Point of View and is _not_ a recommendation to buy/sell the security.

*** DO NOT *** attempt to trade unless you FULLY understand the associated (financial/emotional) risks and you FULLY accept responsibility of the results of your actions.
Mind the levels. Manage the risks. Protect your capital. Protect your gains.

Keywords

StudyList (20) $PXP (12) BULLishStocks (10) $BRN (8) $TEL (8) $X (8) $BLOOM (7) $CHP (7) $CPG (7) $MRC (7) $URC (7) $APX (6) $CEI (6) $FLI (6) $JFC (5) $SGI (5) $WPI (5) $BHI (4) $CLC (4) $GERI (4) $MPI (4) $RLC (4) BobbyAxelRod (4) $ACR (3) $AGI (3) $BEL (3) $CROWN (3) $CYBR (3) $DD (3) $DNL (3) $FGEN (3) $MAXS (3) $MBT (3) $MEG (3) $MWC (3) $NOW (3) $PCOR (3) $PGOLD (3) $PLC (3) $RFM (3) $SCC (3) $SMPH (3) $TUGS (3) $VITA (3) PSEIndex (3) TopWeeklyGainersLosers (3) $ATN (2) $BDO (2) $BPI (2) $COSCO (2) $DMC (2) $EEI (2) $EMP (2) $IMI (2) $ION (2) $JGS (2) $LR (2) $LRW (2) $MED (2) $MRP (2) $MWIDE (2) $PHEN (2) $PIP (2) $ROCK (2) $RRHI (2) $SHLPH (2) $SSI (2) $STI (2) $T (2) $WEB (2) $WLCON (2) Above200dayMA (2) TopMonthlyGainersLosers (2) $2GO (1) $ABS (1) $AEV (1) $ALI (1) $ANI (1) $AT (1) $BSC (1) $CNPF (1) $COAL (1) $EW (1) $FNI (1) $FOOD (1) $FPH (1) $GSMI (1) $GTCAP (1) $HOUSE (1) $IDC (1) $LMG (1) $LTG (1) $MER (1) $MRSGI (1) $NIKL (1) $ORE (1) $PHES (1) $PIZZA (1) $POPI (1) $PPC (1) $PX (1) $ROX (1) $RWM (1) $SMC (1) $SSP (1) $VUL (1) NetForeign (1) TechnicalAnalysis (1) Volx5DAvg (1)

Sunday, December 31, 2017

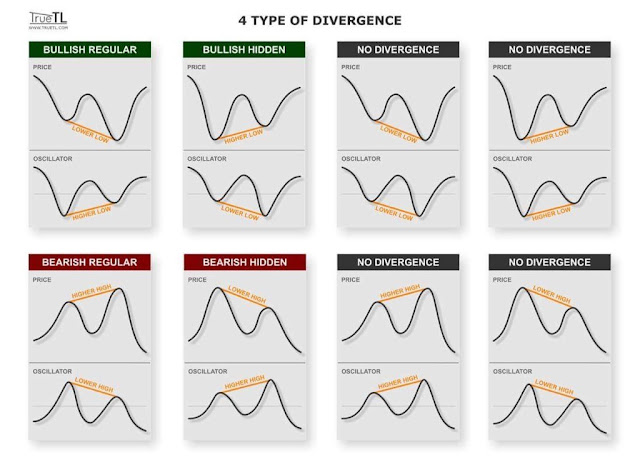
Types of Divergence

Types of Divergence
4 Types of Divergence


BULLish Divergence

  • Regular: Price is creating lower low while Oscillator is creating higher low.
  • Hidden: Price is creating higher low while Oscillator is creating lower low.


BEARish Divergence

  • Regular: Price is creating higher high while Oscillator is creating lower high.
  • Hidden: Price is creating lower high while Oscillator is creating higher high.


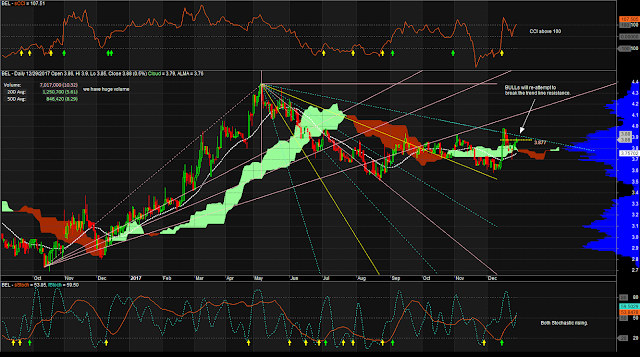
$BEL Study 20171229

$BEL Daily Chart as of December 29, 2017


Notes:
1. Huge volume: 10.32x previous trading day; 5.61x 20-day average; 8.29x 50-day average.
2. CCI rising above 100.
3. Both Stochastic rising above 50.

Sample Trade

  • Entry Price: 3.88
  • Target Price: 4.37 (+11.4%)
  • Stop Loss: 3.73 (-5%)
  • Risk Reward Ratio: 3.27


Mind the levels. Manage the risks. Protect your capital. Protect your gains.

DISCLAIMER: This is my unsolicited Point of View and is _not_ a recommendation to buy/sell the security. 

*** DO NOT *** attempt to trade unless you FULLY understand the associated (financial/emotional) risks and you FULLY accept responsibility of the results of your actions.

Friday, December 29, 2017

$MWC Study 20171229

$MWC Weekly Chart as of December 29, 2017


Notes: Please see image for details.

Mind the levels. Manage the risks. Protect your capital. Protect your gains.

DISCLAIMER: This is my unsolicited Point oView and is _not_ a recommendation to buy/sell the security.

*** DO NOT *** attempt to trade unless you FULLY understand the associated (financial/emotional) risks and you FULLY accept responsibility of the results of your actions.

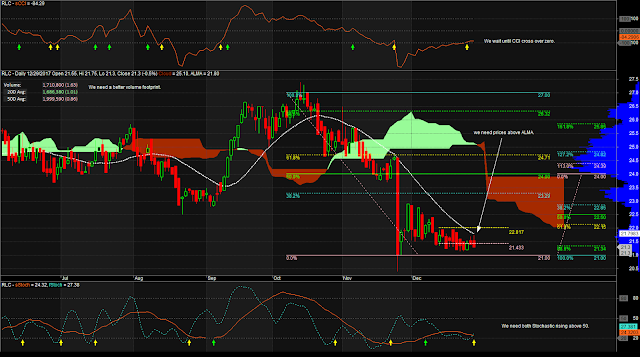
$RLC Study 20171229

$RLC Daily Chart as of December 29, 2017


Notes: Please see image for details.

Mind the levels. Manage the risks. Protect your capital. Protect your gains.

DISCLAIMER: This is my unsolicited Point oView and is _not_ a recommendation to buy/sell the security.

*** DO NOT *** attempt to trade unless you FULLY understand the associated (financial/emotional) risks and you FULLY accept responsibility of the results of your actions.

$CPG Study 20171229

$CPG Daily Chart as of December 29, 2017


Notes: Please see image for details.

Mind the levels. Manage the risks. Protect your capital. Protect your gains.

DISCLAIMER: This is my unsolicited Point oView and is _not_ a recommendation to buy/sell the security.

*** DO NOT *** attempt to trade unless you FULLY understand the associated (financial/emotional) risks and you FULLY accept responsibility of the results of your actions.

$ROCK Study 20171229

$ROCK Daily Chart as of December 29, 2017


Notes:
1. This is an update to $ROCK Study last December 19th
2. We still need volume.
3. Good thing CCI is above zero and rising.
4. fStoch crossed over 20 today and must continue rising.


Mind the levels. Manage the risks. Protect your capital. Protect your gains.

DISCLAIMER: This is my unsolicited Point oView and is _not_ a recommendation to buy/sell the security.

*** DO NOT *** attempt to trade unless you FULLY understand the associated (financial/emotional) risks and you FULLY accept responsibility of the results of your actions.

Watch List (End-of-Day, 29 December 2017)

Watch List (End-of-Day, 29 December 2017)


Notes: the general idea here is that a stock whose Stochastic is below 20 is considered at oversold level (and we only consider a second look at the stock when Stochastic crossed over 20). 

1. New to the list are $BSC, $AR, $REG, $AT, $PX, $PXP, $MAB, $ABSP, and $PHES.
2. Removed from previous listing due to low volume are  $ECP, $ION, $LPZ, $OPM, $FOOD, $ISM, $UPM. Any stock _not_ listed here is because either of their low volume or of their above 22 Stochastic.
3. $ROCK, $CPG, $RLC, $MWC, $LC and $MEG have Stochastic greater than 20.

Vol vs 20D Avg is the ratio of today's volume against the 20-day vx`olume average. Vol vs 50D Avg is the ratio of today's volume against the 50-day volume average.

A value greater than 1 means today's volume is higher than the average (while a value less than 1 means today's volume is lower than the average). A green highlight means today's volume is 50% or more than the average (while a yellow highlight means today's volume is greater than the average but less than 50% more of the average).

Listing Criteria:
1. Volume today must be more than 1M.
2. Stochastic is below 22.

Mind the levels. Manage the risks. Protect your capital. Protect your gains.

DISCLAIMER: This is my unsolicited Point oView and is _not_ a recommendation to buy/sell the security.

*** DO NOT *** attempt to trade unless you FULLY understand the associated (financial/emotional) risks and you FULLY accept responsibility of the results of your actions.

Thursday, December 28, 2017

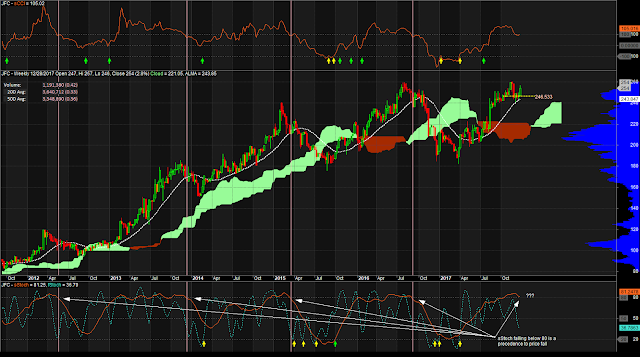
$JFC Study 20171228

$JFC Weekly Chart as of December 28, 2017


Mind the levels. Manage the risks. Protect your capital. Protect your gains.

DISCLAIMER: This is my unsolicited Point oView and is _not_ a recommendation to buy/sell the security.

*** DO NOT *** attempt to trade unless you FULLY understand the associated (financial/emotional) risks and you FULLY accept responsibility of the results of your actions.

$GERI Study 20171228

$GERI Weekly Chart as of December 28, 2017


Mind the levels. Manage the risks. Protect your capital. Protect your gains.

DISCLAIMER: This is my unsolicited Point oView and is _not_ a recommendation to buy/sell the security.

*** DO NOT *** attempt to trade unless you FULLY understand the associated (financial/emotional) risks and you FULLY accept responsibility of the results of your actions.

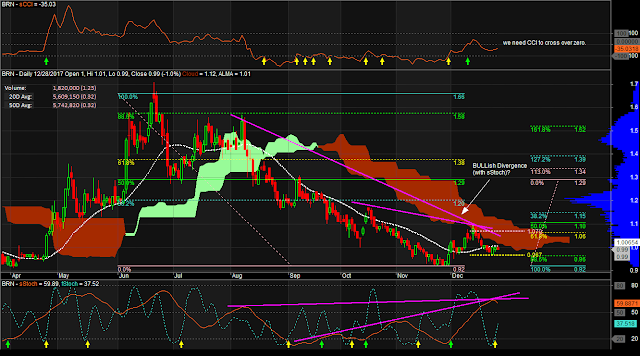
$BRN Study 20171228

$BRN Daily Chart as of December 28, 2017v
$BRN Daily Chart as of December 28, 2017

Notes: 
1. This is an update to Dec 15 $BRN Study.
2. See image for other details.


Mind the levels. Manage the risks. Protect your capital. Protect your gains.

DISCLAIMER: This is my unsolicited Point oView and is _not_ a recommendation to buy/sell the security.

*** DO NOT *** attempt to trade unless you FULLY understand the associated (financial/emotional) risks and you FULLY accept responsibility of the results of your actions.


Wednesday, December 27, 2017

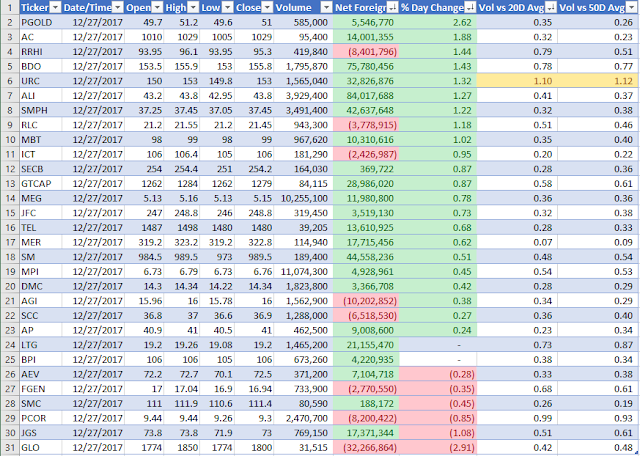
Net Foreign Buying (End-of-Day, 27 Dec 2017)

Net Foreign Buying (End-of-Day, 27 Dec 2017)

Mind the levels. Manage the risks. Protect your capital. Protect your gains.

DISCLAIMER: This is my unsolicited Point oView and is _not_ a recommendation to buy/sell the security.

*** DO NOT *** attempt to trade unless you FULLY understand the associated (financial/emotional) risks and you FULLY accept responsibility of the results of your actions.


PSE Index Status (End-of-Day, 27 Dec 2017)

PSE Index Status (End-of-Day, 27 Dec 2017)

Mind the levels. Manage the risks. Protect your capital. Protect your gains.

DISCLAIMER: This is my unsolicited Point oView and is _not_ a recommendation to buy/sell the security.

*** DO NOT *** attempt to trade unless you FULLY understand the associated (financial/emotional) risks and you FULLY accept responsibility of the results of your actions.


Watch List (End-of-Day, 27 Dec 2017)

Watch List (End-of-Day, 27 Dec 2017)


Notes: the general idea here is that a stock whose Stochastic is below 20 is considered at oversold level (and we only consider a second look at the stock when Stochastic crossed over 20). 

1. New to the list are $ISM, $PHES, $CYBR, $SGI, $MA, $PIP, $ROCK, $ION, $TBGI, $IDC, $PLC, and $MRC.
2. Removed from previous listing are  $MJC, $FGEN, $DNL, $RLC, $CPM, $BHI, and $PXP. Any stock _not_ listed here is because either of their low volume or of their above 22 Stochastic.

Vol vs 20D Avg is the ratio of today's volume against the 20-day vx`olume average. Vol vs 50D Avg is the ratio of today's volume against the 50-day volume average.

A value greater than 1 means today's volume is higher than the average (while a value less than 1 means today's volume is lower than the average). A green highlight means today's volume is 50% or more than the average (while a yellow highlight means today's volume is greater than the average but less than 50% more of the average).

Listing Criteria:
1. Volume today must be more than 1M.
2. Stochastic is below 22.

Mind the levels. Manage the risks. Protect your capital. Protect your gains.

DISCLAIMER: This is my unsolicited Point oView and is _not_ a recommendation to buy/sell the security.

*** DO NOT *** attempt to trade unless you FULLY understand the associated (financial/emotional) risks and you FULLY accept responsibility of the results of your actions.

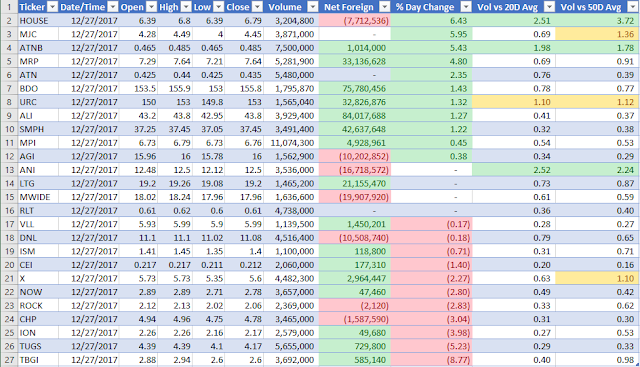
BULLish Stocks (End-of-Day, 27 Dec 2017)

BULLish Stocks (End-of-Day, 27 Dec 2017)


Notes:

1. New to the list are $MRP, $BDO, $URC, $ANI, $LTG, $VLL, $ISM, $NOW, and $ROCK. 

2. Removed from yesterday's list are $SFI, $BLOOM, $MBT, $MAC, $PIZZA, and $PNX. Either their volume fell below 1M or their MACD fell below zero.


Vol vs 20D Avg is the ratio of today's volume against the 20-day volume average. Vol vs 50D Avg is the ratio of today's volume against the 50-day volume average.

A value greater than 1 means today's volume is higher than the average (while a value less than 1 means today's volume is lower than the average). A green highlight means today's volume is 50% or more than the average (while a yellow highlight means today's volume is greater than the average but less than 50% more of the average).

Listing Criteria:
1. Volume today must be more than 1M.
2. MACD(12,26,9) is above zero.


Mind the levels. Manage the risks. Protect your capital. Protect your gains.

DISCLAIMER: This is my unsolicited Point oView and is _not_ a recommendation to buy/sell the security.

*** DO NOT *** attempt to trade unless you FULLY understand the associated (financial/emotional) risks and you FULLY accept responsibility of the results of your actions.


Monday, December 25, 2017

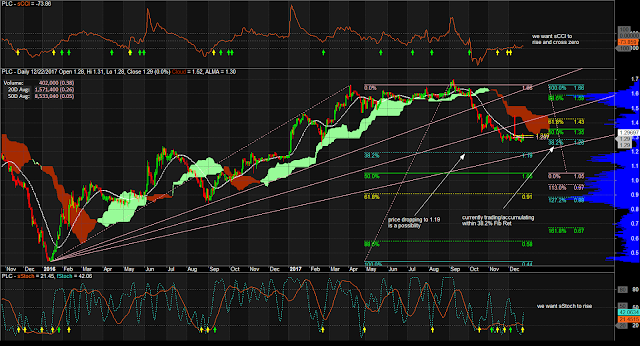
$PLC Study 20171222

$PLC Daily Chart as of December 22, 2017


Notes: 
1. This is an update to Nov 23 $PLC Study.
2. See image for other details.


Mind the levels. Manage the risks. Protect your capital. Protect your gains.

DISCLAIMER: This is my unsolicited Point oView and is _not_ a recommendation to buy/sell the security.

*** DO NOT *** attempt to trade unless you FULLY understand the associated (financial/emotional) risks and you FULLY accept responsibility of the results of your actions.
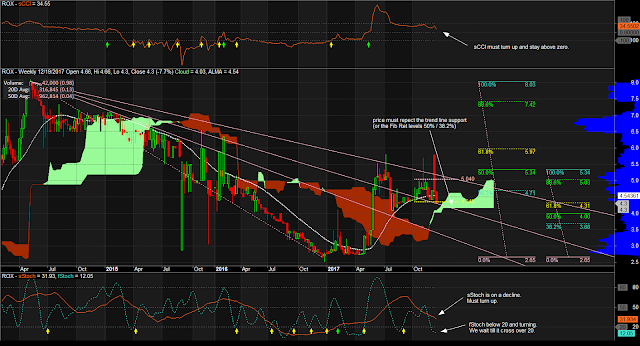
$ROX Study 20171222

$ROX Daily Chart as of December 22, 2017


Notes: 
1. Low Volume stock.
2. See image for other details.


Mind the levels. Manage the risks. Protect your capital. Protect your gains.

DISCLAIMER: This is my unsolicited Point oView and is _not_ a recommendation to buy/sell the security.

*** DO NOT *** attempt to trade unless you FULLY understand the associated (financial/emotional) risks and you FULLY accept responsibility of the results of your actions.

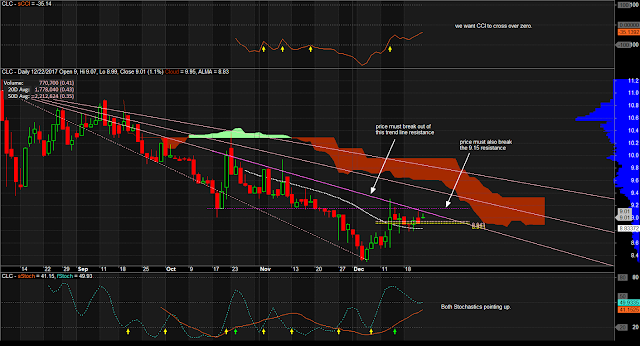
$CLC Study 20171222

$CLC Daily Chart as of December 22, 2017

Notes: 
1. BDO Nomura Rating (as of December 11th) is BUY with Target Price starting at 10.10.
2. Also, see image for other details.

Mind the levels. Manage the risks. Protect your capital. Protect your gains.

DISCLAIMER: This is my unsolicited Point oView and is _not_ a recommendation to buy/sell the security.

*** DO NOT *** attempt to trade unless you FULLY understand the associated (financial/emotional) risks and you FULLY accept responsibility of the results of your actions.